
Page 13 - Non-motor Performance Report
P. 13
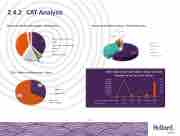
2.4.2 CATAnalysis
Volume of all CAT Claims Open – All Divisions
Volume of CAT Claims Open – Hollard Branches
3%
Western Cape 3%
Commercial and Industrial 38% AGRI
Northern 2%
Central 1%
38%
Central
East Coast JHB
Northern Western Cape
Contruction and Engineering Marine
HPL
Property & Energy
JHB 35%
East Coast 59%
16%
4%
1%
2017 Non-motor CAT Claims Total Incurred Volume vs Av Cost Per Claims
4,000,000 3,500,000 3,000,000 2,500,000 2,000,000 1,500,000 1,000,000
3000
2500
2000
1500
1000
500
500,000 00
AGRI
C&P
C&E
HUB
Marine
P&E
Av of Gross Claims Incurred
87,857
78,758
471,929
41,095
580,360
3,477,35
Volume of Claims
114
2849
91
937
97
136
CATs – Motor vs Non-motor – Open
33%
Motor Non-Motor
67%
Motor 336 Non-motor 690
13
