
Page 21 - Non-motor Performance Report
P. 21
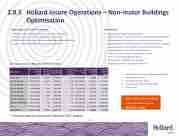
2.8.5 HollardInsureOperations–Non-motorBuildings Optimisation
Leakage Opportunity (Claims Settlement)
> R400m pa spend (HBM on platform, HPL, Agri, off platform)
> 20% saving forecasted (refer to Pretoria case studies)
> R30m Claims Settlement Saving forecasted (excluding off platform)
> Scope – Plumbing, Resultant Damage, Insured Perils
Cost Opportunity (Lost Adjusters and Processing Cost)
Dependencies
> Segmentation Model Implementation
> Implementation of Quantification Tool (Claims Connect/Symbility)
> Claims Handler Role upskilled – technical, product, process
> Implementation of Internal Digital and Field Assessment Capability
> Implementation of Loss Adjustors and Moderation Process
> Implementation of Post Claim Audit function
> Fit for purpose Contractors and Suppliers Panel
> Fit for purpose Loss Adjusters panel
> VAR Solution – Application of Average
> Building Calculator – automated Rate Card
> Internal Digital and Lost Adjustment capability
> Moderation function
> Post Claim Audit function
> On boarding of Quantification Tool
> RFP process
Row Labels
Own Damage –Sumof Paid
Count of Claim_ number
Loss Adjuster – Sum of Paid
Count of Claim_ number
Total Sum of Paid
Current Avg Cost Per Claim
Projected Cost Per Claim
R0-R10 000
R38 973 147
10 488
R1 756 011
583
R40 729 158
R3 883
R3 360
R10 001-R20 000
R16 059 937
1 397
R721 533
250
R16 781 470
R12 013
R11 815
R20 001-R30 000
R10 807 242
537
R659 023
214
R11 466 265
R21 352
R18 137
R30 001-R40 000
R6 039 832
204
R327 844
103
R6 367 676
R31 214
R25 880
R40 001-R50 000
R4 940 135
158
R297 544
88
R5 237 679
R33 150
R27 411
R50 001-R100 000
R17 179 264
326
R927 389
194
R18 106 653
R55 542
R45 347
R100 001-R500 000
R36 484 550
255
R1 139 818
143
R37 624 368
R147 547
R118 010
R500 001-R1 000 000
R11 254 336
23
R187 689
12
R11 442 025
R497 479
R444 214
R1m>
R75 215 794
28
R785 325
24
R76 001 119
R2 714 326
R2 580 012
Grand Total
R216 954 238
13 416
R6 802 175
1 611
R223 756 413
R16 678
R14 709
• R30m Claims Settlement saving
• Input cost of R4m required
• ROI of 85% – R26m
* Forecasts based on January to December 2017 analysis.
21
