
Page 34 - Australian Defence Magazine Dec 2018 - Jan 2019
P. 34
T
Workforce
The workforce side of the ledger is also fascinating reading this year. ADM intro- duced two new questions to the survey; percentage of female participation (see Ta- ble 3) and whether companies had a Rec- onciliation Action Plan (RAP) or similar policy. ADM went out to almost 100 com- panies to take part in the 2018 survey, with 66 responding. Of those 66, 25 (16.5 per cent) operating a RAP with another three companies operating an informal Indig- enous support policies.
When it comes to gender diversity, the numbers did not quite confirm the long-held suspicion that female participation industry is woeful. The average company has about 24 per cent female workforce, which is much higher than expected but leaves plenty of room for improvement. There are of course outliers (as seen in table 3) but active poli- cies in many companies to attract and retain their female workers are having an effect.
The total headcount for the Top 40 and Top 20 SMEs combined (excluding dupli- cates) was 35,577, with another ~2,000 peo-
ple sitting outside those lists that responded to the survey.
Growth areas
Defence infrastructure programs are an excellent example of growth in the defence community. Whilst their export prospects are not great (exporting bricks and mortar vs exporting a design) as a whole, their Aus- tralian Industry Capability (AIC) figures are excellent (see tables 4 and 5 for more).
“The investment in the Defence Estate reflects its renewed priority and recog- nises that it is a fundamental enabler of capability,” David Barnes, Global Client Director – Defence and National Secu- rity at Aurecon said to ADM. “While it is great to see this investment, the collec- tive challenge for industry and Defence is to how we drive change and deliver the investment to meet the Government’s expectations. Building an improved
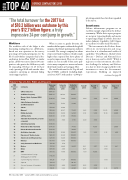
Table 5 Top 20 AIC, R&D and Exports
continued on page 98
Export Export % 2018 2018
81.00 90.00
59.73 95.00 15.10 26.00
20.00 3.15 9.00
SME Position 2018
Company
Turnover Industry Industry 2018 Content Content %
millions 2018 2018
$156.00
$105.29 105.29 100.00
$90.00 72.00 80.00 $81.58 76.52 93.80
RandD RandD % 2018 2018
2.80 4.00
3.85 6.00 3.10 5.50
4.00 8.80
10.00 1.25 3.60
1 CPB Contractors
2 St Hilliers Property
3 Electro Optic Systems (EOS) Group
4 Cubic Defence Australia and New Zealand
5 Safran $72.00 33.00
6 Marand $62.88 45.27 72.00
7 RUAG Australia
8 CAE Australia
9 Selex ES Australia (A Leonardo company)
10 Chemring Australia
11 Rockwell Collins Australia
12 Rohde & Schwarz Australia
13 Air Affairs Australia
14 Daronmont Technologies
15 Shamrock Civil Engineering
$54.00 52.50 92.50 $48.00 41.00 85.00
$45.00 8.00 17.70
$38.00
$35.00 75.00 $33.00 40.00 $30.40 35.00 100.00 $26.20 26.20 100.00 $21.80 92.40 100.00
16 Kinexus $19.60 19.60 100.00
17 Craig International Ballistics $17.40 5.70
18 Birdon $17.00 24.40 90.00
19 Eylex $15.80 4.00
20 BMT $13.50 13.50 100.00
21 Communications Design $12.20
& Management (CDM)
22 Customs Agency Services $11.25 11.25 100.00
23 Supacat $11.03 88.10
24 Cincom Systems of Australia $10.00 8.00 80.00
25 EPE $8.81 6.66 42.80
3.35 9.91 0.25 0.50
0.21 2.07 1.30 10.00
0.25 2.50 0.03 0.20
3.50
4.16 26.70
34 | December 2018 – January 2019 | www.australiandefence.com.au
OP40
DEFENCE CONTRACTORS 2018
“The total turnover for the 2017 list
of $10.2 billion was outshone by this year’s $12.7 billion figure, a truly impressive 24 per cent jump in growth.”
2018
