
Page 108 - Zero Net Energy Case Study Homes-Volume 2
P. 108
CASE STUDY NO. 10
COTTAGES AT CYPRESS
3.50
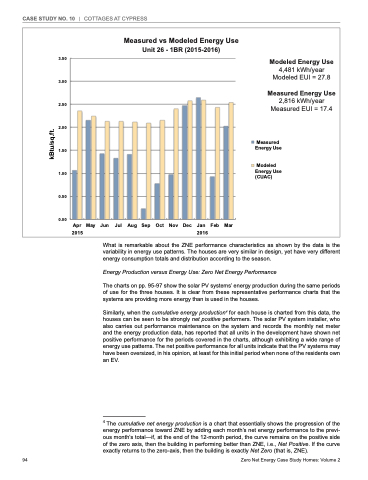
Unit 26 - 1BR (2015-2016)
3.50
Modeled Energy Use
4,481 kWh/year Modeled EUI = 27.8
Measured Energy Use
2,816 kWh/year Measured EUI = 17.4
Measured Measured Energy Use Energy Use
Measured vs Modeled Energy Use
Measured vs Modeled Energy Use
Measured vs Modeled Energy Use
Unit 26 (2015-2016)
Unit 26 (2015-2016)
3.00
3.00
2.50
2.50
2.00
2.00
1.50
1.50
1.00
Energy Use Energy Use (CUAC) (CUAC)
1.00
Modeled Modeled
0.50
0.50
0.00
0.00 Apr May Jun Jul Aug Sep Oct Nov Dec Jan Feb Mar Apr May Jun Jul Aug Sep Oct Nov Dec Jan Feb Mar
2015 2016 2015 2016
What is remarkable about the ZNE performance characteristics as shown by the data is the variability in energy use patterns. The houses are very similar in design, yet have very different energy consumption totals and distribution according to the season.
Energy Production versus Energy Use: Zero Net Energy Performance
The charts on pp. 95-97 show the solar PV systems’ energy production during the same periods of use for the three houses. It is clear from these representative performance charts that the systems are providing more energy than is used in the houses.
Similarly, when the cumulative energy production4 for each house is charted from this data, the houses can be seen to be strongly net positive performers. The solar PV system installer, who also carries out performance maintenance on the system and records the monthly net meter and the energy production data, has reported that all units in the development have shown net positive performance for the periods covered in the charts, although exhibiting a wide range of energy use patterns. The net positive performance for all units indicate that the PV systems may have been oversized, in his opinion, at least for this initial period when none of the residents own an EV.
4 The cumulative net energy production is a chart that essentially shows the progression of the energy performance toward ZNE by adding each month’s net energy performance to the previ- ous month’s total—if, at the end of the 12-month period, the curve remains on the positive side of the zero axis, then the building in performing better than ZNE, i.e., Net Positive. If the curve exactly returns to the zero-axis, then the building is exactly Net Zero (that is, ZNE).
94
Zero Net Energy Case Study Homes: Volume 2
kkBBtutu/s/sqq.f.tf.t.
