
Page 100 - Designing for Zero Carbon - Case Studies of All-Electric Buildings
P. 100
CASE STUDY NO. 4 REDFORD CONSERVANCY AT PITZER COLLEGE
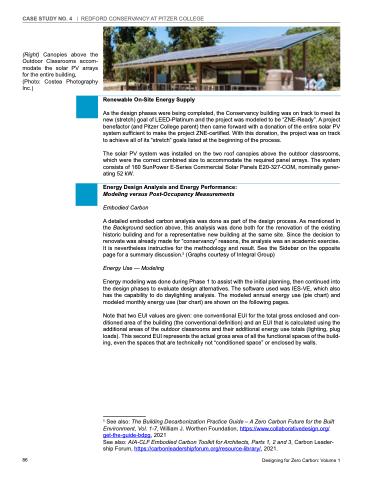
(Right) Canopies above the Outdoor Classrooms accom- modate the solar PV arrays for the entire building,
(Photo: Costea Photography Inc.)
Renewable On-Site Energy Supply
As the design phases were being completed, the Conservancy building was on track to meet its new (stretch) goal of LEED-Platinum and the project was modeled to be “ZNE-Ready”. A project benefactor (and Pitzer College parent) then came forward with a donation of the entire solar PV system sufficient to make the project ZNE-certified. With this donation, the project was on track to achieve all of its “stretch” goals listed at the beginning of the process.
The solar PV system was installed on the two roof canopies above the outdoor classrooms, which were the correct combined size to accommodate the required panel arrays. The system consists of 160 SunPower E-Series Commercial Solar Panels E20-327-COM, nominally gener- ating 52 kW.
Energy Design Analysis and Energy Performance:
Modeling versus Post-Occupancy Measurements
Embodied Carbon
A detailed embodied carbon analysis was done as part of the design process. As mentioned in the Background section above, this analysis was done both for the renovation of the existing historic building and for a representative new building at the same site. Since the decision to renovate was already made for “conservancy” reasons, the analysis was an academic exercise. It is nevertheless instructive for the methodology and result. See the Sidebar on the opposite page for a summary discussion.5 (Graphs courtesy of Integral Group)
Energy Use — Modeling
Energy modeling was done during Phase 1 to assist with the initial planning, then continued into the design phases to evaluate design alternatives. The software used was IES-VE, which also has the capability to do daylighting analysis. The modeled annual energy use (pie chart) and modeled monthly energy use (bar chart) are shown on the following pages.
Note that two EUI values are given: one conventional EUI for the total gross enclosed and con- ditioned area of the building (the conventional definition) and an EUI that is calculated using the additional areas of the outdoor classrooms and their additional energy use totals (lighting, plug loads). This second EUI represents the actual gross area of all the functional spaces of the build- ing, even the spaces that are technically not “conditioned space” or enclosed by walls.
5 See also: The Building Decarbonization Practice Guide – A Zero Carbon Future for the Built Environment, Vol. 1-7, William J. Worthen Foundation, https://www.collaborativedesign.org/ get-the-guide-bdpg, 2021
See also: AIA-CLF Embodied Carbon Toolkit for Architects, Parts 1, 2 and 3, Carbon Leader- ship Forum, https://carbonleadershipforum.org/resource-library/, 2021.
86
Designing for Zero Carbon: Volume 1
