
Page 79 - Designing for Zero Carbon - Case Studies of All-Electric Buildings
P. 79
KAISER MEDICAL OFFICE BUILDING
CASE STUDY NO. 3
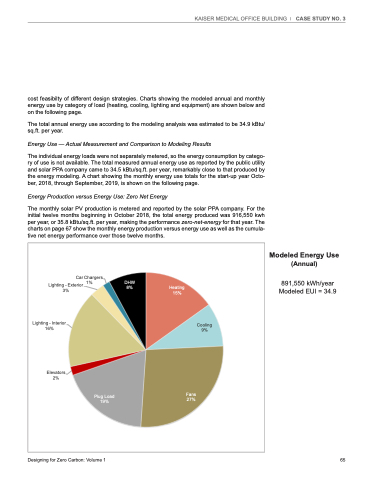
cost feasibilty of different design strategies. Charts showing the modeled annual and monthly energy use by category of load (heating, cooling, lighting and equipment) are shown below and on the following page.
The total annual energy use according to the modeling analysis was estimated to be 34.9 kBtu/ sq.ft. per year.
Energy Use — Actual Measurement and Comparison to Modeling Results
The individual energy loads were not separately metered, so the energy consumption by catego- ry of use is not available. The total measured annual energy use as reported by the public utility and solar PPA company came to 34.5 kBtu/sq.ft. per year, remarkably close to that produced by the energy modeling. A chart showing the monthly energy use totals for the start-up year Octo- ber, 2018, through September, 2019, is shown on the following page.
Energy Production versus Energy Use: Zero Net Energy
The monthly solar PV production is metered and reported by the solar PPA company. For the initial twelve months beginning in October 2018, the total energy produced was 916,550 kwh per year, or 35.8 kBtu/sq.ft. per year, making the performance zero-net-energy for that year. The charts on page 67 show the monthly energy production versus energy use as well as the cumula- tive net energy performance over those twelve months.
Modeled Annual Energy Use
Modeled Energy Use (Annual)
891,550 kWh/year Modeled EUI = 34.9
Car Chargers
Lighting-Exterior 1% 3%
Lighting - Interior 16%
Elevators 2%
DHW
8% Heating
15%
Cooling 9%
Plug Load 19%
Fans 27%
Designing for Zero Carbon: Volume 1
65
