
Page 11 - Zero Net Energy Case Study Buildings-Volume 3
P. 11
INTRODUCTION ZERO NET ENERGY CASE STUDY BUILDINGS, VOL. 3
The Duck Curve Conundrum
In 2008, the National Renewable Energy Laboratory (NREL) published the results of the first study2 of the impact on the electric power grid of the then-future integration of the large-scale solar PV systems. This became a concern with the advent of various initiatives to encourage the installation of these systems to provide carbon-free electric power to buildings and transporta- tion. The statewide goal of ZNE buildings throughout the building industry soon followed and the relatively sudden drop in the cost of the PV systems made this issue more pressing.
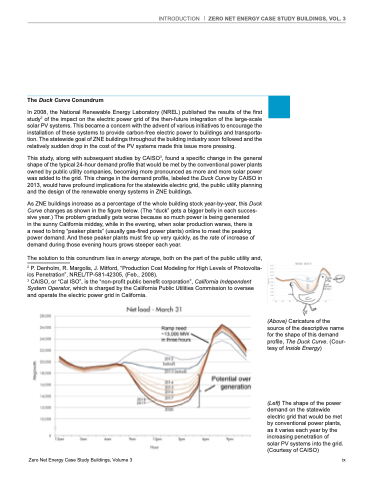
This study, along with subsequent studies by CAISO3, found a specific change in the general shape of the typical 24-hour demand profile that would be met by the conventional power plants owned by public utility companies, becoming more pronounced as more and more solar power was added to the grid. This change in the demand profile, labeled the Duck Curve by CAISO in 2013, would have profound implications for the statewide electric grid, the public utility planning and the design of the renewable energy systems in ZNE buildings.
As ZNE buildings increase as a percentage of the whole building stock year-by-year, this Duck Curve changes as shown in the figure below. (The “duck” gets a bigger belly in each succes- sive year.) The problem gradually gets worse because so much power is being generated
in the sunny California midday, while in the evening, when solar production wanes, there is
a need to bring “peaker plants” (usually gas-fired power plants) online to meet the peaking power demand. And these peaker plants must fire up very quickly, as the rate of increase of demand during those evening hours grows steeper each year.
The solution to this conundrum lies in energy storage, both on the part of the public utility and,
2 P. Denholm, R. Margolis, J. Mitford, “Production Cost Modeling for High Levels of Photovolta- ics Penetration”, NREL/TP-581-42305, (Feb., 2008).
3 CAISO, or “Cal ISO”, is the “non-profit public benefit corporation”, California Independent System Operator, which is charged by the California Public Utilities Commission to oversee and operate the electric power grid in California.
Zero Net Energy Case Study Buildings, Volume 3
ix
(Above) Caricature of the source of the descriptive name for the shape of this demand profile, The Duck Curve. (Cour- tesy of Inside Energy)
(Left) The shape of the power demand on the statewide electric grid that would be met by conventional power plants, as it varies each year by the increasing penetration of
solar PV systems into the grid. (Courtesy of CAISO)
