
Page 69 - Zero Net Energy Case Study Buildings-Volume 1
P. 69
IDeAs OFFICE BUILDING
The measured energy use by type of energy end use for 2011-2012 is shown in the pie chart on the facing page. This is accompanied by the monthly measured performance for this same period with the same monthly breakdown of each category of energy use. The relative size and importance of the plug load (including the servers) in buildings with such low energy loads is ap- parent from these charts.
Energy Production versus Energy Use: Zero Net Energy
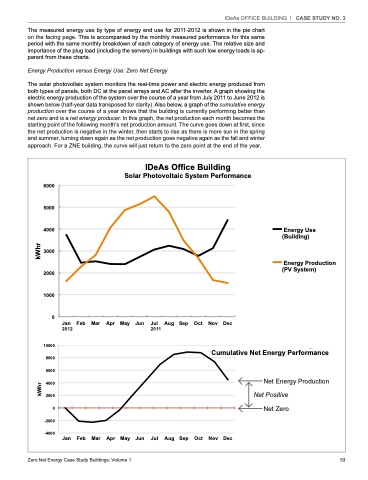
The solar photovoltaic system monitors the real-time power and electric energy produced from both types of panels, both DC at the panel arrays and AC after the inverter. A graph showing the electric energy production of the system over the course of a year from July 2011 to June 2012 is shown below (half-year data transposed for clarity). Also below, a graph of the cumulative energy production over the course of a year shows that the building is currently performing better than net zero and is a net energy producer. In this graph, the net production each month becomes the starting point of the following month’s net production amount. The curve goes down at first, since the net production is negative in the winter, then starts to rise as there is more sun in the spring and summer, turning down again as the net production goes negative again as the fall and winter approach. For a ZNE building, the curve will just return to the zero point at the end of the year.
CASE STUDY NO. 3
IDeAs Office Building Cumulative Net Energy Performance
2012 2011
140000 ID
8000
eAs Office Building Energy Use
(Building) Cumulative Net Energy Performance
3000
6000 4000
Energy Production
Net Energy Production
2000
2000 0
Net Positive
Net Zero
(PV System)
1000
-2000
-4000
0
10000
8000
6000
4000 2000
JanJFaenbFeMbarMaArprApMrayMayJunJunJulJulAuAgugSeSpepOOccttNNovDec 0
6000
5000
4000
3000
2000
1000
6000
Energy Use (Building)
Energy Production (PV System)
IDeAs Office Building
Solar Photovoltaic System Performance
IDeAs Office Building
Solar Photovoltaic System Performance
0
5000 Jan Feb Mar Apr May Jun Jul Aug Sep Oct Nov Dec
Zero Net Energy Case Study Buildings: Volume 1 -2000 -4000
53
Jan Feb Mar Apr May Jun
Jul Aug Sep
Oct N
kWhr
kWhr kWhr kWhr
o
