
Page 68 - Zero Net Energy Case Study Buildings-Volume 2
P. 68
CASE STUDY NO. 9 SPECULATIVE OFFICE BUILDING AT 435 INDIO WAY
Sidebar: Profitability
The building featured in Case Study No. 9 is regarded by its owners as primarily a financial investment, not a R&D project and not necessarily a demonstration project for highly sustainable ZNE buildings. With this prime directive in mind, they could have developed the property with a business-as-usual (BAU) approach—a code-minimum building with the lowest first cost possible. They strongly suspected, however, that in their market and for this type of risk investment, the ZNE design approach would actually prove to be more profitable according to the standard financial analysis used by developers. This proved to be a correct assessment in the end, as the summary analysis in this Sidebar shows.
The owners used a 7.5% “cap rate”1. For the building, the income stream divided by the cap rate equals the value of this investment. The market in this type of real estate was 5.5% - 6% at the time, so setting a higher standard for the performance of the investment was a conser- vative strategy and a hedge against any changes in the market before leasing could start.
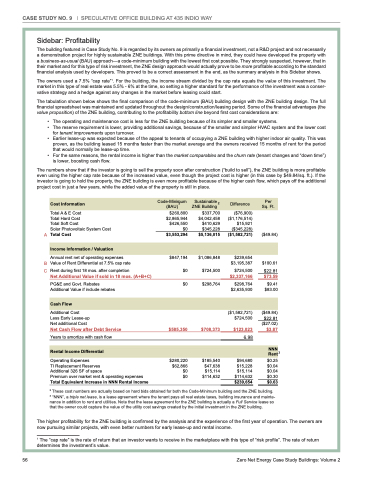
The tabulation shown below shows the final comparison of the code-minimum (BAU) building design with the ZNE building design. The full financial spreadsheet was maintained and updated throughout the design/construction/leasing period. Some of the financial advantages (the value proposition) of the ZNE building, contributing to the profitability bottom line beyond first cost considerations are:
• The operating and maintenance cost is less for the ZNE building because of its simpler and smaller systems.
• The reserve requirement is lower, providing additional savings, because of the smaller and simpler HVAC system and the lower cost
for tenant improvements upon turnover.
• Earlier lease-up was expected because of the appeal to tenants of occupying a ZNE building with higher indoor air quality. This was
proven, as the building leased 15 months faster than the market average and the owners received 15 months of rent for the period
that would normally be lease-up time.
• For the same reasons, the rental income is higher than the market comparables and the churn rate (tenant changes and “down time”)
is lower, boosting cash flow.
The numbers show that if the investor is going to sell the property soon after construction (“build to sell”), the ZNE building is more profitable even using the higher cap rate because of the increased value, even though the project cost is higher (in this case by $49.84/sq. ft.). If the investor is going to hold the property, the ZNE building is even more profitable because of the higher cash flow, which pays off the additional project cost in just a few years, while the added value of the property is still in place.
Code-Minimum Sustainable Per Cost Information (BAU) 2 ZNE Building 2 Difference Sq. Ft.
Total A & E Cost
Total Hard Cost
Total Soft Cost
Solar Photovoltaic System Cost
A Total Cost
Income Information / Valuation
Annual rent net of operating expenses
B Value of Rent Differential at 7.5% cap rate
C Rent during first 18 mos. after completion
Net Additional Value if sold in 18 mos. (A+B+C)
PG&E and Govt. Rebates Additional Value if include rebates
Cash Flow
Additional Cost
Less Early Lease-up
Net additional Cost
Net Cash Flow after Debt Service
Years to amortize with cash flow
Operating Expenses
TI Replacement Reserves
Additional 326 SF of space
Premium over market rent & operating expenses Total Equivalent Increase in NNN Rental Income
$260,800 $2,865,944 $426,550 $0 $3,553,294
$847,194 $0
$0
$585,350
$280,220 $62,866 $0 $0
$337,700 $4,042,458 $410,629 $345,228 $5,136,015
$1,086,848 $724,500
$298,764
$708,373
$185,540 $47,638 $15,114
$114,632
($76,900) ($1,176,514) $15,921 ($345,228) ($1,582,721)
$239,654 $3,195,387
$724,500
$2,337,166
$298,764 $2,635,930
($1,582,721) $724,500
$123,023
65.8998 $94,680
$15,228
$15,114 $114,632 $239,654
($49.84)
$100.61 $22.81
$73.59
$9.41 $83.00
($49.84) $22.81 ($27.02) $3.87
$0.25 $0.04 $0.04 $0.30 $0.63
Rental Income Differential
NNN Rent
3
The higher profitability for the ZNE building is confirmed by the analysis and the experience of the first year of operation. The owners are now pursuing similar projects, with even better numbers for early lease-up and rental income.
1 The “cap rate” is the rate of return that an investor wants to receive in the marketplace with this type of “risk profile”. The rate of return determines the investment’s value.
2 These cost numbers are actually based on hard bids obtained for both the Code-Minimum building and the ZNE building. 3 “NNN”, a triple net lease, is a lease agreement where the tenant pays all real estate taxes, building insurance and mainte- nance in addition to rent and utilities. Note that the lease agreement for the ZNE building is actually a Full Service lease so that the owner could capture the value of the utility cost savings created by the initial investment in the ZNE building.
56
Zero Net Energy Case Study Buildings: Volume 2
