
Page 6 - The Case for Better Cleaning Aged Care Management
P. 6
WHAT CAN BE ACHIEVED WITH
The next key piece of data is to work
out your current CHR (Cleaning Heart rate)
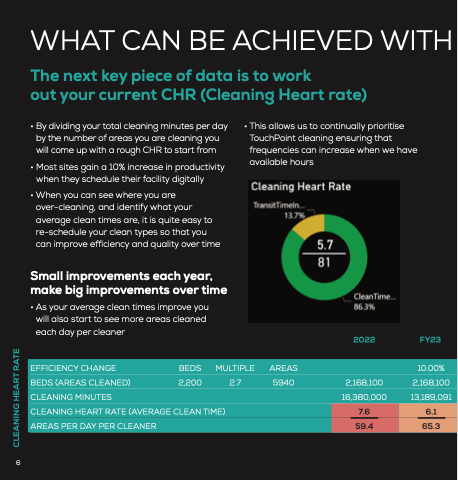
• By dividing your total cleaning minutes per day by the number of areas you are cleaning you will come up with a rough CHR to start from
• Most sites gain a 10% increase in productivity when they schedule their facility digitally
• When you can see where you are over-cleaning, and identify what your average clean times are, it is quite easy to re-schedule your clean types so that you can improve efficiency and quality over time
Small improvements each year, make big improvements over time
• As your average clean times improve you will also start to see more areas cleaned each day per cleaner
• This allows us to continually prioritise TouchPoint cleaning ensuring that frequencies can increase when we have available hours
2022 FY23
EFFICIENCY CHANGE BEDS MULTIPLE AREAS 10.00%
BEDS (AREAS CLEANED) 2,200 2.7 5940 2,168,100 2,168,100
CLEANING MINUTES 16,380,000 13,189,091
CLEANING HEART RATE (AVERAGE CLEAN TIME)
7.6
6.1
AREAS PER DAY PER CLEANER
59.4
65.3
6
CLEANING HEART RATE
