
Page 6 - Ramsay Corporate Introduction 24P
P. 6
6
WHAT CAN BE ACHIEVED WITH
The next key piece of data is to work
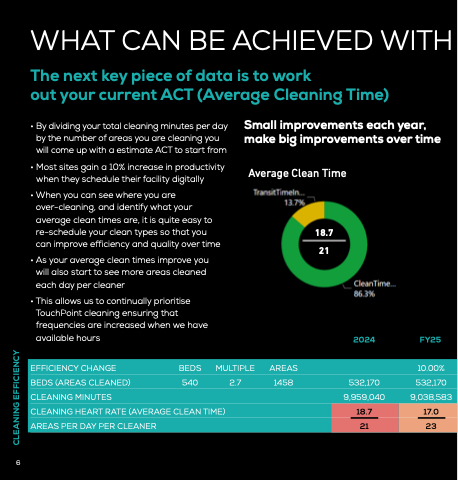
out your current ACT (Average Cleaning Time)
• By dividing your total cleaning minutes per day by the number of areas you are cleaning you will come up with a estimate ACT to start from
• Most sites gain a 10% increase in productivity when they schedule their facility digitally
• When you can see where you are over-cleaning, and identify what your average clean times are, it is quite easy to re-schedule your clean types so that you can improve efficiency and quality over time
• As your average clean times improve you will also start to see more areas cleaned each day per cleaner
• This allows us to continually prioritise TouchPoint cleaning ensuring that frequencies are increased when we have available hours
Small improvements each year, make big improvements over time
Average Clean Time
18.7 21
2024 FY25
CLEANING EFFICIENCY
EFFICIENCY CHANGE BEDS MULTIPLE AREAS 10.00%
BEDS (AREAS CLEANED) 540 2.7 1458 532,170 532,170
CLEANING MINUTES 9,959,040 9,038,583
CLEANING HEART RATE (AVERAGE CLEAN TIME)
18.7
17.0
AREAS PER DAY PER CLEANER
21
23
