
Page 47 - Minerva Foods | Annual Report 2017
P. 47
Main indicators (R$ millions)
Slaughter (thousands)
Sales volume (1,000 t)
Gross revenue
Domestic market
Foreign market
Net revenue*
Adjusted Ebitda*
Adjusted Ebitda margin*
Net debt/LTM Adjusted Ebitda*
Net profit (losses)
4Q17
869.3
238.8
4,251.6
1,848.8
2,402.8
3,964.7
363.4
9.2%
4.6
(313.5)
4Q16
479.8
129.4
2,729.3
1,182.0
1,547.3
2,556.4
249.9
9.8%
3.4
12.3
Variation (%)
81.2
84.5
55.8
56.4
55.3
55.1
45.4
-0.6 p.p.
1.1
N/D
3Q17
804.2
215.5
3,659.5
1,531.8
2,127.8
3,417.8
311.8
9.1
4.2
85.8
Variation (%)
8.1
10.8
16.2
20.7
12.9
16.0
16.6
0.0 p.p.
0.4
N/D
2017
2,775.8
731.6
12,981.4
5,379.9
7,601.5
14,033.5
1,265.8
9.0%
4.6
(280.9)
2016
2,132.2
548.1
10,263.0
3,806.8
6,456.2
9,648.7
989.3
10.3%
3.4
195.0
Variation (%)
30.2
33.5
26.5
41.3
17.7
45.4
28.0
-1.2 p.p.
1.1
N/D
* 2017 includes pro forma net revenue and Ebitda figures for the plants in the Mercosul assets acquired on August 1, 2017.
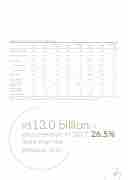
R$13.0 billion in
gross revenue in 2017, 26.5% more than the
previous year
47
