
Page 52 - Minerva Foods | Annual Report 2017
P. 52
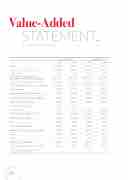
Value-Added
STATEMENT
(In thousands of Brazilian reals)
Revenue 6,592,827
201-1
Consolidated
9,722,186
9,637,469
84,717
(8,641,802)
(7,456,396)
(1,185,406)
1,080,384
(80,367)
1,000,017
142,466
-
142,466
1,142,483
1,142,483
360,411
52,415
534,622
496,280
38,342
195,035
194,870
165
 2017
2016
6,343,812
6,306,666
37,146
(5,567,903)
(4,866,647)
(701,256)
775,909
(43,382)
732,527
254,693
141,785
112,908
987,220
987,220
241,688
50,193
500,469
484,914
15,555
194,870
194,870
2017
12,158,401
12,067,854
90,547
(10,807,290)
(9,384,842)
(1,422,448)
1,351,111
(145,020)
1,206,091
104,216
-
104,216
1,310,307
1,310,307
448,674
134,976
1,007,340
963,353
43,987
(280,683)
(281,023)
340
2016
Parent Company
   Sale of goods, products, and services
Other income
Inputs acquired from third parties
(Tax inclusive – ICMS, IPI, PIS and COFINS)
Costs of products, goods and services sold
Materials, energy, third-party services, and others
Gross value added
Depreciation, depletion and amortization
Net added value produced by the organization
Added value received in transfer
Result of equity accounting
Financial income
Total value added for distribution (5+6)
Distribution of value added
Labor
Taxes, fees and contributions
Remuneration to third-party capital providers
6,556,140
36,687
(5,833,979)
(4,974,437)
(859,542)
758,848
(75,659)
683,189
(48,560)
(125,375)
76,815
634,629
634,629
248,687
110,436
556,529
                Interest 544,598
Rent 11,931
  Remuneration to shareholders
Earnings withheld/losses for the fiscal years
Non-controlling interest in retained earnings (only consolidated)
(281,023)
(281,023)
    52
