
Page 30 - Anuário Estatístico da Companhias Abertas 2017/2018
P. 30
Retrospectiva Retrospective
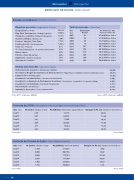
MERCADODEDÍVIDA Debtmarket
Emissões de Debêntures Private bonds launch
Total de emissões Total issues
Ano
Year
Quantidade
Quantity
Vol. nanceiro (R$)
Financial volume (R$)
2007
46
47,68 bilhões / billion
2008
36
41,93 bilhões / billion
2009
59
15,37 bilhões / billion
2010
19
52,29 bilhões / billion
2011
167
50,71 bilhões / billion
2012
248
89,99 bilhões / billion
2013
279
70,47 bilhões / billion
2014
288
75,25 bilhões / billion
2015
180
64,52 bilhões / billion
2016
166
59,02 bilhões / billion
Registros por setor Registrations X Sector
Energia Elétrica / Power
23,14%
Emp. Adm. Participações / Holding Companies
21,05%
Transporte e Logística / Transport and Logistics
17,3%
Assistência Médica / Medical care
7,30%
Comércio Varejista / Retail Trade
7,13%
Construção Civil / Civil Construction
5,23%
Financeiro / Financial
5,1%
TI e Telecomunicações / IT and Telecommunication
2,4%
Outros / Others
2,0%
Petróleo e Gás / Oil and Gas
2,0%
Seguradora / Insurance Company
1,8%
Saneamento / Sanitation
1,8%
Destino das emissões Allocation of issues
Re nanciamento de passivo / Re nancing of liabilities
33,90%
Recompra ou Resgate de Debêntures de Emissão Anterior / Repurchase or redemption of previous debenture issues
28,35%
Capital de Giro / Working capital
14,45%
Investimento em Infraestrutura / Investment in infrastructure
9,40%
Investimento ou Aquisição de Participações Societárias / Investment in or acquisition of corporate holdings
9,03%
Investimento em Imobilizado / Investment in xed assets
3,37%
Não informado / Not informed
0,76%
Implantação de projetos / Project implementation
0,74%
Fonte: CETIP – Elaboração: ANBIMA
Source: CETP – Elaboration: ANBIMA
Evolução dos FIDCs Development of the Credit Rights Investment Funds (FIDCs)
Ano / Year
No fundos / Number of funds
PL (milhões) / Shareholders equity (millions)
Variação do PL (%) / Variation in net worth (%)
Dez/11
228
74.375
48,54
Dez/12
397
64.291
-13,56
Dez/13
447
71.305
10,91
Dez/14
469
66.303
-12,65
Dez/15
571
74.561
12,45
Dez/16
565
92.293
10,70
Fonte: Anbid
Source: Anbid
Evolução dos Fundos de Ações Share Fund Development
Ano / Year
No fundos / Number of funds
PL (milhões) / Net worth (millions)
Variação do PL (%) / Variation in net worth (%)
Dez/11
1.989
179.552
-9,80
Dez/12
2.002
206.156
14,82
Dez/13
2.068
119.789
-41,89
Dez/14
2.097
174.108
45,35
Dez/15
1.904
139.856
-19,67
Dez/16
1.752
150.049
7,29
Fonte: Anbid
Source: Anbid
30
