
Page 94 - Anuário Estatístico da Companhias Abertas 2017/2018
P. 94
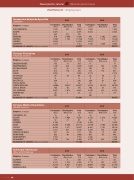
    Desempenho setorial Sectorial performance EMPREGOS Employment
          Saneamento e Serviços de Água e Gás
Sanitation
Empresa / Company CAB AMBIENTAL
CASAN
CEG
COMGÁS
COPASA
SABESP
SANEPAR
Acumulado do subsetor / Subsector accumulated
Serviços Financeiros
Financial services
Empresa / Company BBSEGURIDADE
BM&FBOVESPA BR INSURANCE CETIP
CIELO
Contratados
Hired
1.532 2.581 462
2015
Terceirizados
Outsourced
537
Total Contratados
Total Hired
2.069 1.565 2.581 2.622
783
4.388 952
13.166 11.325 14.223 14.137 7.417 7.325
44.627
Total Contratados
Total Hired
163 11 2.070 1.401 943 702 788 731 2.052 2.279 98 62
2016
Terceirizados
Outsourced
2.102 1.215
1.369
2016
Terceirizados
Outsourced
782 13 116
Total
Total
1.565 2.622
3054 12.540 14.137 8.694 42.612
Total
Total
11 2.183 715 847 2.279 72
             321 979 3.409 11.983 1.183
   14.223 7.417
Contratados
Hired
2015
Terceirizados
Outsourced
11 678 32 116
                 152 1.392 911 672 2.052 88
10
10
     GP INVEST
IDEASNET 8 8808
  MULTIPLUS 246 PAR AL BAHIA 35 PORTO SEGURO 14.000 SEG AL BAHIA 106 SUL AMÉRICA 5.607 TARPON INV 30 WIZ S.A ND Acumulado do subsetor / Subsector accumulated
Serviços Médico-Hospitalares
Wealth services
246 269 61 36 35 1 30.627 14.125 16.579 146 100 44 6.681 5.295 919 32 27 2
330 36 30.704 144 6.214 29
43.572
Total
Total
16 6.365
 1 16.627 40 1.074 2
2015
Terceirizados
Outsourced
3 ALLIAR 4.192 1.066
ND
       43.890
   2016
          Empresa / Company
ADVANCED- DH 15
Contratados
Total Contratados Terceirizados
Total Hired Outsourced
18 16
5.258 5.152 1.213
Hired
   BIOMM
CREMER
DASA
FLEURY
IH.PARDINI
NORTEC QUÍMICA
OURO FINO
ODONTOPREV
QUALICORP
Acumulado do subsetor / Subsector accumulated
Siderurgia e Metalurgia
Steel and metallurgy
Empresa / Company ALIPERTI
FERBASA GERDAU MANGELS INDL
52 31 83 68 6 74
 3.140
36.284 4.488
8.550 1.677
3.140 40.772 10.227 4.248 273 1.060 1.553 3.460 70.092
Total
Total
120 4.566 44.012 2.117
2.456
33.780 4.706
8.401 1.791
2.456 38.486 10.192 5.300 236 946 1.456 3.388 68.915
Total
Total
50 3.651 37.976 1.944
   3.417 227 962 1.553 2.736
Contratados
Hired
111 3.241 35.145 1.986
831 46 98
724
2015
Terceirizados
Outsourced
9 1.325 8.867 131
4.384 224 861 1.456 2.756
Contratados
Hired
43 2.719 30.014 1.836
916 12 85
632
2016
Terceirizados
Outsourced
7 932 7.962 108
                         94
