
Page 24 - Anuario Abrasca 19_20
P. 24
Retrospectiva Retrospective
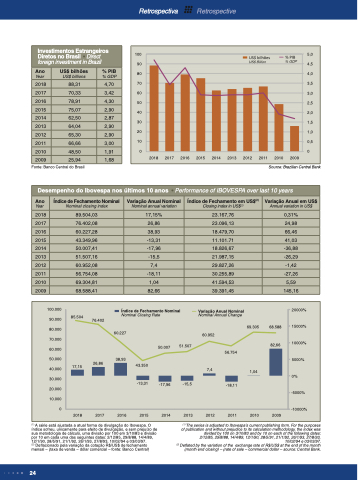
Investimentos Estrangeiros Diretos no Brasil Direct foreign investment in Brazil
Ano
Year
US$ bilhões
US$ billions
% PIB
% GDP
2018
88,31
4,70
2017
70,33
3,42
2016
78,91
4,30
2015
75,07
2,90
2014
62,50
2,87
2013
64,04
2,90
2012
65,30
2,90
2011
66,66
3,00
2010
48,50
1,91
2009
25,94
1,68
100 5,0 90 4,5 80 4,0 70 3,5 60 3,0 50 2,5 40 2,0 30 1,5 20 1,0 10 0,5
00 2018 2017 2016 2015 2014 2013 2012 2011 2010 2009
Fonte: Banco Central do Brasil
Source: Brazilian Central Bank
Desempenho do Ibovespa nos últimos 10 anos Performance of IBOVESPA over last 10 years
Ano
Year
Índice de Fechamento Nominal
Nominal closing index
Variação Anual Nominal
Nominal annual variation
Índice de Fechamento em US$(2)
Closing index in US$(2)
Variação Anual em US$
Annual variation in US$
2018
89.504,03
17,15%
23.167,76
0,31%
2017
76.402,08
26,86
23.096,13
24,98
2016
60.227,28
38,93
18.479,70
66,46
2015
43.349,96
-13,31
11.101.71
41,03
2014
50.007,41
-17,96
18.826,67
-36,88
2013
51.507,16
-15,5
21.987,15
-26,29
2012
60.952,08
7,4
29.827,26
-1,42
2011
56.754,08
-18,11
30.255,89
-27,26
2010
69.304,81
1,04
41.594,53
5,59
2009
68.588,41
82,66
39.391,45
145,16
100.000
90.000
80.000 70.000 60.000 50.000 40.000 30.000 20.000 10.000
0
Índice de Fechamento Nominal
Nominal Closing Rate
Variação Anual Nominal
20000% 15000% 10000% 5000% 0% -5000% -10000%
85.504
Nominal Annual Change
76.402
17,15 26,86
2018 2017
43.350 -13,31
2015
-17,96 -15,5
2014 2013
7,4
2012
56.754
-18,11
2011
(1) A série está ajustada a atual forma de divulgação do Ibovespa. O índice sofreu, unicamente para efeito de divulgação, e sem prejuízo de sua metodologia de cálculo, uma divisão por 100 em 3/10/83 e divisão por 10 em cada uma das seguintes datas: 2/12/85, 29/8/88, 14/4/89, 12/1/90, 28/5/91, 21/1/92, 26/1/93, 27/8/93, 10/02/94 e 03/03/97.
(2) Deflacionado pela variação da cotação R$/US$ de fechamento mensal – (taxa de venda – dólar comercial – fonte: Banco Central)
(1) The series is adjusted to Ibovespa’s current publishing form. For the purposes of publication and without prejudice to its calculation methodology, the index was divided by 100 on 3/10/83 and by 10 on each of the following dates: 2/12/85, 29/8/88, 14/4/89, 12/1/90, 28/5/91, 21/1/92, 26/1/93, 27/8/93, 10/02/94 e 03/03/97. (2) Deflated by the variation of the exchange rate of R$/US$ at the end of the month (month end closing) – (rate of sale – commercial dollar – source: Central Bank.
60.227
38,93
2016
50.007
60.952 51.507
69.305
1,04
2010
68.588 82,66
2009
24
