
Page 53 - Anuario Abrasca 19_20
P. 53
Desempenho setorial Sectorial performance
PETRÓLEO E GÁS, PETROQUÍMICA, EMBALAGEM E PLÁSTICO
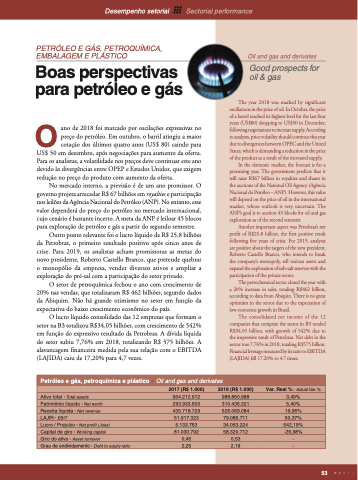
Boas perspectivas para petróleo e gás
Oano de 2018 foi marcado por oscilações expressivas no preço do petróleo. Em outubro, o barril atingiu a maior cotação dos últimos quatro anos (US$ 80) caindo para
US$ 50 em dezembro, após negociações para aumento da oferta. Para os analistas, a volatilidade nos preços deve continuar este ano devido às divergências entre OPEP e Estados Unidos, que exigem redução no preço do produto com aumento da oferta.
No mercado interno, a previsão é de um ano promissor. O governo projeta arrecadar R$ 67 bilhões em royalties e participação nos leilões da Agência Nacional do Petróleo (ANP). No entanto, esse valor dependerá do preço do petróleo no mercado internacional, cujo cenário é bastante incerto. A meta da ANP é leiloar 45 blocos para exploração de petróleo e gás a partir do segundo semestre.
Outro ponto relevante foi o lucro líquido de R$ 25,8 bilhões da Petrobras, o primeiro resultado positivo após cinco anos de crise. Para 2019, os analistas acham promissoras as metas do novo presidente, Roberto Castello Branco, que pretende quebrar o monopólio da empresa, vender diversos ativos e ampliar a exploração do pré-sal com a participação do setor privado.
O setor de petroquímica fechou o ano com crescimento de 20% nas vendas, que totalizaram R$ 462 bilhões, segundo dados da Abiquim. Não há grande otimismo no setor em função da expectativa do baixo crescimento econômico do país.
O lucro líquido consolidado das 12 empresas que formam o setor na B3 totalizou R$34,05 bilhões, com crescimento de 542% em função do expressivo resultado da Petrobras. A dívida líquida do setor subiu 7,76% em 2018, totalizando R$ 575 bilhões. A alavancagem financeira medida pela sua relação com o EBITDA (LAJIDA) caiu de 17,20% para 4,7 vezes.
Petróleo e gás, petroquímica e plástico Oil and gas and derivates
Oil and gas and derivates
Good prospects for oil & gas
The year 2018 was marked by significant oscillations in the price of oil. In October, the price of a barrel reached its highest level for the last four years (US$80) dropping to US$50 in December, following negotiations to increase supply. According to analysts, price volatility should continue this year due to divergences between OPEC and the United States, which is demanding a reduction in the price of the product as a result of the increased supply.
In the domestic market, the forecast is for a promising year. The government predicts that it will raise R$67 billion in royalties and shares in the auctions of the National Oil Agency (Agência Nacional do Petróleo – ANP). However, this value will depend on the price of oil in the international market, whose outlook is very uncertain. The ANP’s goal is to auction 45 blocks for oil and gas exploration as of the second semester.
Another important aspect was Petrobras’s net profit of R$25.8 billion, the first positive result following five years of crisis. For 2019, analysts are positive about the targets of the new president, Roberto Castello Branco, who intends to break the company’s monopoly, sell various assets and expand the exploration of sub-salt reserves with the participation of the private sector.
The petrochemical sector closed the year with a 20% increase in sales, totaling R$462 billion, according to data from Abiquin. There is no great optimism in the sector due to the expectation of low economic growth in Brazil.
The consolidated net income of the 12 companies that comprise the sector in B3 totaled R$34.05 billion, with growth of 542% due to the impressive result of Petrobras. Net debt in the sector rose 7.76% in 2018, totaling R$575 billion. Financial leverage measured by its ratio to EBITDA (LAJIDA) fell 17.20% to 4.7 times.
2017 (R$ 1.000)
2018 (R$ 1.000)
Var. Real % Actual Var. %
Ativo total Total assets
954.212.912
988.860.988
310.436.321
3,49%
Patrimônio líquido Net worth
293.933.503
5,40%
Receita líquida Net revenue
435.718.729
526.069.084
19,96%
LAJIR EBIT
Lucro / Prejuízo Net profit (-loss)
51.917.323
79.085.711
34.053.224
50,37%
5.133.763
542,19%
Capital de giro Working capital
81.030.792
58.320.712
-26,98%
Giro do ativo Asset turnover
0,46
0,53
-
Grau de endividamento Debt to equity ratio
2,25
2,19
-
53
