
Page 43 - STRATEGY Magazine
P. 43
Emerging Economies
Drive Global Growth
in 2017—And Beyond
WORLD ECONOMIC OUTLOOK: GaINING MOMENTUM?
A resurgence in commodity prices and metals is set to drive emerging markets to
new highs this year as the advanced economies resume lukewarm growth. It all
points to increased convergence betweenFigthure 1d.1e2v. eGlDoPpGinrogwtahn, 1d99d9–e2v0e2l1oped world. (Percent)
Althou recover cast gai the los of thes protrac mies in an imp discuss for a p import is forec
Produ
Med emergi
the pac GDP p a gradu weak le stay be cial cri (Figure
The years a the leg
suggest Europe
If the global economy does expand by more than 3 per- cent this year, as the International Monetary Fund (IMF) predicts, do not thank the United States or Ja- pan. Look to emerging economies instead. In recent
decades, emerging markets—those that have infrastruc- ture and financial markets but still lack the technology, reg- ulatory mechanisms, and human capital of the developed world—have been responsible for about 75 percent of world economic growth. While 2016 was the worst year for emerg- ing countries since the financial crisis, most experts believe that 2017 should see these markets roar back to growth of above 4 percent, while much of the Eurozone, as an exam- ple of an advanced economy, limps forward at 0.5 percent.
UNTAPPED POTENTIAL, INCREASED RISK
Of course, one reason for these higher rates is the relative- ly low level of development found in emerging economies. Countries such as Thailand, Nigeria, and Russia offer low labor costs that appeal to the globalized value chains of the 21st century. Now that many emerging economies of- fer ample opportunity for foreign direct investment into a range of projects, they have become a dynamo of growth. It is worth remembering that emerging economies are not frontier economies; they typically enjoy some level of legal and physical infrastructure that sets them on a course to- ward modernization.
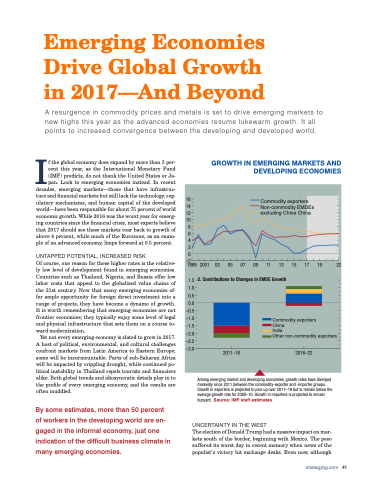
Among emerging market and developing economies, growth rates have diverged markedly since 2011 between the commodity-exporter and -importer groups.
By some estimates, more than 50 percent of workers in the developing world are en- gaged in the informal economy, just one indication of the difficult business climate in many emerging economies.
mies in wh
GROWTH IN EMERGING MARKETS AND
Growth in exporters is projected to pick up over 2017–19 but to remain below the average growth rate for 2000–10. GrDowEthVinEimLpOortPersINis GprojEecCtedOtoNreOmaMin IES buoyant.
1. Growth in Emerging Market and Developing Economies
18 16 14 12 10
8 6 4 2 0
–2
1999 2001 03
Commodity exporters Non-commodity EMDEs excluding China China
05 07
09 11 13 15
17 19 22
2. Contributions to Changes in EMDE Growth
1.5 1.0 0.5 0.0
–0.5 –1.0 –1.5 –2.0 –2.5 –3.0
3. Growth in Low-Income Developing Countries
Commodity exporters China
India
WORLD ECONOMIC OUTLOOK: GaININOGthMeOrMnEoNnTU-cMo?mmodity exporters
2011–16 2016–22
18
(Percent)
Figure 1.12. GDP Growth, 1999–2021
Yet not every emerging economy is slated to grow in 2017.
A host of political, environmental, and cultural challenges confront markets from Latin America to Eastern Europe;
some will be insurmountable. Parts of sub-Saharan Africa
will be impacted by crippling drought, while continued po-
litical instability in Thailand repels tourists and financiers
alike. Both global trends and idiosyncratic details play in to
the profile of every emerging economy, and the results are
often muddled. 12
Although c
16 Nigeria
Among emerging market and developing economies, growth rates have diverged
cast gains a
4
2 UN14CERTAINTY IN THE WEST
produc
Others
the losses a
14 markedly since 2011 between the commodity-exporter and -importer groups. Commodity exporters excluding Nigeria and Yemen
10 8
6 18 1. Growth in Emerging Market and Developing Economies
ure 1.1
Growth in exporters is projected to pick up over 2017–19 but to remain below the average growth rate for 2000–10. Growth in importers is projected to remain buoyant. Source: IMF staff estimates
of these co
16 Commodity exporters Non-commodity EMDEs
for a protr
0 Th1e2 election of Donald Trump heaxcdluadmingasCshiivnea iCmhpinact on mar- 10
Sub
1999 2001 03 05 07 09 11 13 15 17 19
22
synchr
8
suffered its worst day in recent memory when news of the
6
Prodfutchtievi that we
populist’s victory hit exchange desks. Even now, although
4
Source: IMF staff estimates.
Medium
2
Note: Commodity exporters includes fuel and nonfuel primary products exporters,
0 strategybg.com 41 includi as indicated in Table D of the Statistical Appendix, plus Brazil and Peru. EMDE = emerging
emergi–n2g market and developing economy.
1999 2001 03 05 07 09 11 13 15 17 19 22
theapdaocpetoif
formin
recovery in
capital
of capi
In a n
protracted
cycle a
of capi
an importa discussion
–2 kets south of the border, beginning with Mexico. The peso
able tre
important
is forecast t
g
s e
i r a
c
n
l s
n a
t
u
u
l
t
i
a
d
r
o g
n
m
o
