
Page 1 - AAG133_Sequence of Returns Flyer
P. 1
Strategic Use of Home Equity in
Retirement Planning
Managing the Sequence of Returns Risk Scenario
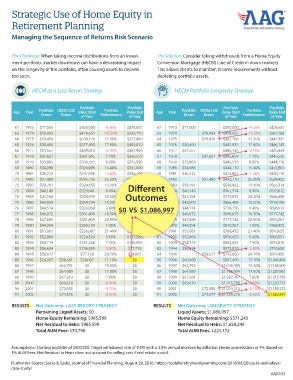
The Challenge: When taking income distributions from an invest- The Solution: Consider taking withdrawals from a Home Equity
ment portfolio, market downturns can have a devastating impact Conversion Mortgage (HECM) Line of Credit in down markets.
on the longevity of the portfolio, often causing assets to deplete This allows clients to maintain income requirements without
too soon. depleting portfolio assets.
HECM as a Last Resort Strategy HECM Portfolio Longevity Strategy
Portfolio Portfolio Portfolio Portfolio
Age Year Portfolio HECM LOC Value Start Portfolio Value End Age Year Portfolio HECM LOC Value Start Portfolio Value End
Draws Draws of Year Performance of Year Draws Draws of Year Performance of Year
62 1973 $27,500 $500,000 -9.30% $428,652 62 1973 $27,500 $500,000 -9.30% $428,652
63 1974 $28,463 $428,652 -15.50% $338,120 63 1974 $28,463 $428,652 -15.50% $362,168
64 1975 $29,459 $338,120 22.30% $377,493 64 1975 $29,459 $362,168 22.30% $442,932
65 1976 $30,490 $377,493 17.90% $409,013 65 1976 $30,490 $442,932 17.90% $486,145
66 1977 $31,557 $409,013 -4.10% $361,905 66 1977 $31,557 $486,145 -4.10% $435,859
67 1978 $32,661 $361,905 2.20% $336,552 67 1978 $32,661 $435,859 2.20% $445,535
68 1979 $33,805 $336,552 8.00% $326,998 68 1979 $33,805 $445,535 8.00% $444,710
69 1980 $34,988 $326,998 15.40% $337,009 69 1980 $34,988 $444,710 15.40% $472,861
70 1981 $36,212 $337,009 -1.40% $296,706 70 1981 $36,212 $472,861 -1.40% $430,710
71 1982 $37,480 $296,706 25.20% $324,655 71 1982 $37,480 $430,710 25.20% $539,422
$323,941
Diff
73t
72 1983 $38,791 $324,655 13.30% $308,935 eren 1983 $38,791 $539,422 13.30% $567,314
72
73 1984 $40,149 $323,941 8.90% 1984 $40,149 $567,314 8.90% $573,872
$334,734
74
74 1985 $41,554 $308,935 25.20% Outcomes 1985 $41,554 $573,872 25.20% $666,408
75 1986 $43,009 $334,734 15.20% $336,068 75 1986 $43,009 $666,408 15.20% $718,156
76
1987
76 1987 $44,514 $336,068 3.40% $0 VS $1,086,997 $44,514 $718,156 3.40% $696,613
$301,496
77 1988 $46,072 $301,496 10.30% $281,809 77 1988 $46,072 $696,613 10.30% $717,742
78 1989 $47,685 $281,809 20.90% $283,150 78 1989 $47,658 $717,742 20.90% $810,367
79 1990 $49,354 $283,150 1.00% $236,087 79 1990 $49,354 $810,367 1.00% $768,472
80 1991 $51,081 $236,087 21.40% $224,524 80 1991 $51,081 $768,472 21.40% $870,625
81 1992 $52,869 $224,524 5.60% $181,268 81 1992 $52,869 $870,625 5.60% $863,551
82 1993 $54,719 $181,268 7.90% $136,559 82 1993 $54,719 $863,551 7.90% $872,810
83 1994 $56,634 $136,559 -2.80% $77,718 83 1994 $56,634 $872,810 -2.80% $793,650
84 1995 $58,617 $77,718 24.70% $24,007 84 1995 $58,617 $793,650 24.70% $997,459
85 1996 $24,007 $36,661 $24,007 11.10% $0 85 1996 $60,668 $997,459 11.10% $1,040,493
86 1997 $62,791 $0 19.30% $0 86 1997 $62,792 $1,040,493 19.30% $1,165,909
87 1998 $64,989 $0 17.00% $0 87 1998 $64,989 $1,165,909 17.00% $1,287,967
88 1999 $67,264 $0 7.80% $0 88 1999 $67,264 $1,287,967 7.80% $1,315,795
89 2000 $69,618 $0 -0.90% $0 89 2000 $69,618 $1,315,795 -0.90% $1,234,712
90 2001 $72,055 $0 -3.70% $0 90 2001 $72,055 $1,234,712 -3.70% $1,189,275
91 2002 $74,576 $0 -8.60% $0 91 2002 $74,577 $1,189,275 -8.60% $1,086,997
RESULTS Net Outcome: LAST RESORT STRATEGY RESULTS Net Outcome: LONGEVITY STRATEGY
Remaining Liquid Assets: $0 Liquid Assets: $1,086,997
Home Equity Remaining: $985,599 Home Equity Remaining: $571,243
Net Residual to Heirs: $985,599 Net Residual to Heirs: $1,658,240
Total AUM Fees: $70,796 Total AUM Fees: $221,172
Assumptions: Starting portfolio of $500,000. Target withdrawal rate of 5.5% with a 3.5% annual increase for inflation. Home appreciation at 4%. Based on
1% AUM Fees. Net Residual to Heirs does not account for selling cost if real estate is sold.
Illustration Source: Sacks & Sacks, Journal of Financial Planning, August 20, 2016. https://toolsforretirementplanning.com/2016/08/20/sacks-and-lafaye-
case-study/
AAG133