
Page 13 - 2016 Las Vegas Residential Real Estate Report
P. 13
DISTRESSED
HOUSING
Not long ago, Las Vegas became famous not
only for its entertainment, but for its foreclosures. Large sections of distressed homes severely punished values in many Las Vegas neighborhoods.
In 2009 and 2010, homes that had mortgages with balances exceeding the value of the home, what we call negative equity, exceeded 70 percent for all homes with a mortgage. We can’t ignore the fact that negative equity lingers today, however it has dropped dramatically to roughly 16 percent.9 This represents a decline of about three percent from the same quarter of last year. So while negative equity is very much elevated from historical levels, a lot of healing has taken place and we see the problem as only being acute (from an economics perspective) in some speci c communities.
Some homeowners may still nd that they owe more on their home than it is worth and due to nancial or job mobility reasons, they need to sell. This is called a short sale and although this practice is less common than it was just two years ago, many of our agents have signi cant experience in navigating with short sales.
While we still get calls from buyers looking to purchase foreclosures, either through auction or the
MANY OF OUR AGENTS HAVE SIGNIFICANT EXPERIENCE IN NAVIGATING WITH SHORT SALES
multiple listing service, the supply of lender owned homes nished the year at around three percent of for-sale single family homes in the multiple listing service. The local real estate market is once again dominated by traditional sales.
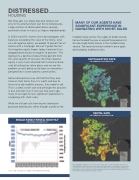
Note that higher rental rates do not necessarily correlate with net yields (Cap Rate). Areas that can command higher rental rates are often associated with higher expenses, including taxes, home owner association fees and occasionally special improvement district fees, impacting returns. Additionally, many of the nicer areas experience strong competition from owner-occupants, bidding up prices for the home itself, the denominator in the cap rate formula.
CAPITALIZATION RATE –GEOGRAPHIC DISTRIBUTION–
RENTAL RATE –GEOGRAPHIC DISTRIBUTION–
SINGLE-FAMILY RENTAL MONTHLY –PRICE PER SQUARE FOOT–
Source: Clark County Assessor, GLVAR, Coldwell Banker Premier Realty
