
Page 9 - TSU
P. 9
An Examination of Prosecutorial Caseloads:
In Search of a Standard
CENTER FOR JUSTICE RESEARCH
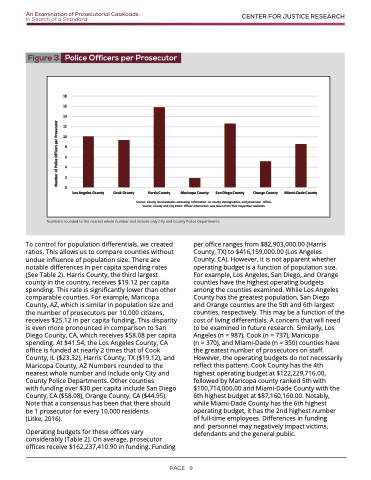
Figure 3.
Police Officers per Prosecutor
18 16 14 12 10
8 6 4 2 0
Los Angeles County
Cook County
Harris County
Maricopa County
San Diego County
Orange County
Miami-Dade County
Source: County level websites containing information on county demographics and prosecutor offices. Source: County and City Police Officer information was taken from their respective websites.
Numbers rounded to the nearest whole number and include only City and County Police Departments
To control for population differentials, we created ratios. This allows us to compare counties without undue influence of population size. There are notable differences in per capita spending rates (See Table 2). Harris County, the third largest county in the country, receives $19.12 per capita spending. This rate is significantly lower than other comparable counties. For example, Maricopa County, AZ, which is similar in population size and the number of prosecutors per 10,000 citizens, receives $25.12 in per capita funding. This disparity is even more pronounced in comparison to San Diego County, CA, which receives $58.08 per capita spending. At $41.54, the Los Angeles County, CA office is funded at nearly 2 times that of Cook County, IL ($23.32), Harris County, TX ($19.12), and Maricopa County, AZ Numbers rounded to the nearest whole number and include only City and County Police Departments. Other counties
with funding over $30 per capita include San Diego County, CA ($58.08), Orange County, CA ($44.95). Note that a consensus has been that there should be 1 prosecutor for every 10,000 residents
(Litke, 2016).
Operating budgets for these offices vary considerably (Table 2). On average, prosecutor offices receive $162,237,410.90 in funding. Funding
per office ranges from $82,903,000.00 (Harris County, TX) to $416,159,000.00 (Los Angeles County, CA). However, it is not apparent whether operating budget is a function of population size. For example, Los Angeles, San Diego, and Orange counties have the highest operating budgets among the counties examined. While Los Angeles County has the greatest population, San Diego
and Orange counties are the 5th and 6th largest counties, respectively. This may be a function of the cost of living differentials. A concern that will need to be examined in future research. Similarly, Los Angeles (n = 987), Cook (n = 737), Maricopa
(n = 370), and Miami-Dade (n = 350) counties have the greatest number of prosecutors on staff. However, the operating budgets do not necessarily reflect this pattern. Cook County has the 4th highest operating budget at $122,229,716.00, followed by Maricopa county ranked 5th with $100,714,000.00 and Miami-Dade County with the 6th highest budget at $87,160,160.00. Notably, while Miami-Dade County has the 6th highest operating budget, it has the 2nd highest number of full-time employees. Differences in funding
and personnel may negatively impact victims, defendants and the general public.
PAGE 9
Number of Police Officers per Prosecutor
