
Page 11 - TSU
P. 11
An Examination of Prosecutorial Caseloads:
In Search of a Standard
within the prosecutors office. Research suggests that improper staffing has significant implications for the daily functions and support offered to prosecutorial teams including case processing, case outcomes, stress, and prosecutor burnout.
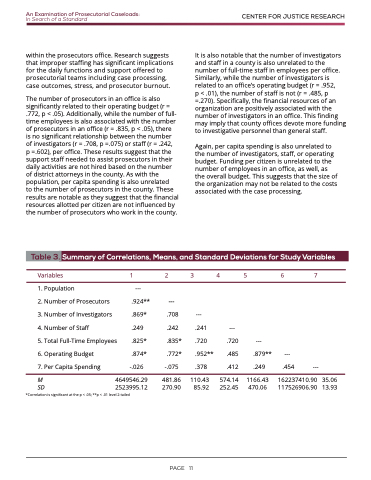
The number of prosecutors in an office is also significantly related to their operating budget (r = .772, p < .05). Additionally, while the number of full- time employees is also associated with the number of prosecutors in an office (r = .835, p < .05), there
is no significant relationship between the number of investigators (r = .708, p =.075) or staff (r = .242,
p =.602), per office. These results suggest that the support staff needed to assist prosecutors in their daily activities are not hired based on the number of district attorneys in the county. As with the population, per capita spending is also unrelated
to the number of prosecutors in the county. These results are notable as they suggest that the financial resources allotted per citizen are not influenced by the number of prosecutors who work in the county.
CENTER FOR JUSTICE RESEARCH
It is also notable that the number of investigators and staff in a county is also unrelated to the number of full-time staff in employees per office. Similarly, while the number of investigators is related to an office’s operating budget (r = .952,
p < .01), the number of staff is not (r = .485, p =.270). Specifically, the financial resources of an organization are positively associated with the number of investigators in an office. This finding may imply that county offices devote more funding to investigative personnel than general staff.
Again, per capita spending is also unrelated to the number of investigators, staff, or operating budget. Funding per citizen is unrelated to the number of employees in an office, as well, as the overall budget. This suggests that the size of the organization may not be related to the costs associated with the case processing.
Table 3.
Summary of Correlations, Means, and Standard Deviations for Study Variables
Variables 1 2345 6 7
1. Population
2. Number of Prosecutors
3. Number of Investigators
4. Number of Staff
5. Total Full-Time Employees
6. Operating Budget
7. Per Capita Spending
M
---
.924** ---
.869* .708 ---
.249 .242 .825* .835* .874* .772*
-.026 -.075
4649546.29 481.86
2523995.12 270.90 *Correlation is significant at the p < .05; **p < .01 level 2-tailed
.241 --- .720 .720 .952** .485 .378 .412
110.43 574.14 85.92 252.45
---
.879** ---
.249 .454 ---
SD
1166.43 470.06
162237410.90 117526906.90
35.06 13.93
PAGE 11
