
Page 7 - TSU
P. 7
An Examination of Prosecutorial Caseloads:
In Search of a Standard
CASELOAD COMPARISONS
CENTER FOR JUSTICE RESEARCH
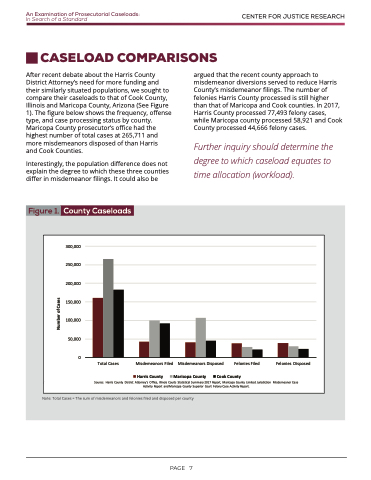
After recent debate about the Harris County District Attorney’s need for more funding and their similarly situated populations, we sought to compare their caseloads to that of Cook County, Illinois and Maricopa County, Arizona (See Figure 1). The figure below shows the frequency, offense type, and case processing status by county. Maricopa County prosecutor’s office had the highest number of total cases at 265,711 and more misdemeanors disposed of than Harris
and Cook Counties.
Interestingly, the population difference does not explain the degree to which these three counties differ in misdemeanor filings. It could also be
argued that the recent county approach to misdemeanor diversions served to reduce Harris County’s misdemeanor filings. The number of felonies Harris County processed is still higher than that of Maricopa and Cook counties. In 2017, Harris County processed 77,493 felony cases, while Maricopa county processed 58,921 and Cook County processed 44,666 felony cases.
Further inquiry should determine the degree to which caseload equates to time allocation (workload).
Figure 1.
300, 000 250, 000 200, 000 150, 000 100, 000
50, 000 0
Total Cases
Misdemeanors Filed
Harris County
Misdemeanors Disposed
Felonies Filed
Felonies Disposed
Maricopa County Cook County
: Total Cases = The sum of misdemeaSnoourcsea:nHdafrerlisonCoieusnftiyleDdisatnridctdAisttpoornseyd’speOrffcicoeu, nIlltinyois Courts Statistical Summary 2017 Report, Maricopa County Limited Jurisdiction Misdemeanor Case Activity Report and Maricopa County Superior Court Felony Case Activity Report.
Note
Note: Total Cases = The sum of misdemeanors and felonies filed and disposed per county
County Caseloads
PAGE 7
Number of Cases
