
Page 7 - SellerGuide
P. 7
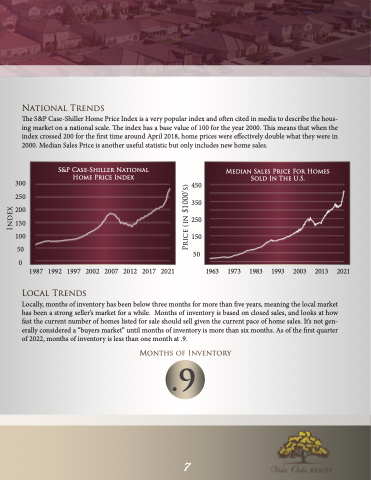
 National Trends
The S&P Case-Shiller Home Price Index is a very popular index and often cited in media to describe the hous- ing market on a national scale. The index has a base value of 100 for the year 2000. This means that when the index crossed 200 for the first time around April 2018, home prices were effectively double what they were in 2000. Median Sales Price is another useful statistic but only includes new home sales.
  S&P Case-Shiller National Home Price Index
300
250
200
150
100 150
50 50 0 1987 1992 1997 2002 2007 2012 2017 2021
Local Trends
Locally, months of inventory has been below three months for more than five years, meaning the local market has been a strong seller’s market for a while. Months of inventory is based on closed sales, and looks at how fast the current number of homes listed for sale should sell given the current pace of home sales. It’s not gen- erally considered a “buyers market” until months of inventory is more than six months. As of the first quarter of 2022, months of inventory is less than one month at .9.
Months of Inventory
.9
450 350 250
Median Sales Price For Homes Sold In The U.S.
1963 1973 1983 1993 2003 2013 2021
  7
 Index
Price (in $1000’s)
