Page 463 - Introduction To Sociology
P. 463
Chapter 20 | Population, Urbanization, and the Environment 455
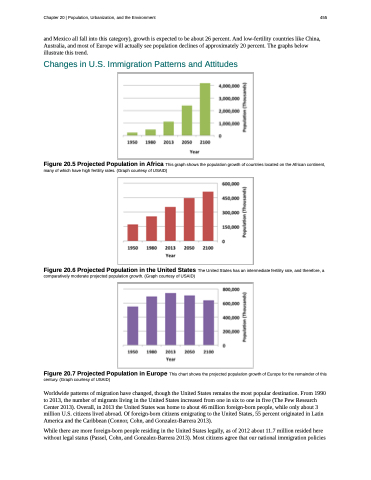
and Mexico all fall into this category), growth is expected to be about 26 percent. And low-fertility countries like China, Australia, and most of Europe will actually see population declines of approximately 20 percent. The graphs below illustrate this trend.
Changes in U.S. Immigration Patterns and Attitudes
Figure 20.5 Projected Population in Africa This graph shows the population growth of countries located on the African continent, many of which have high fertility rates. (Graph courtesy of USAID)
Figure 20.6 Projected Population in the United States The United States has an intermediate fertility rate, and therefore, a comparatively moderate projected population growth. (Graph courtesy of USAID)
Figure 20.7 Projected Population in Europe This chart shows the projected population growth of Europe for the remainder of this century. (Graph courtesy of USAID)
Worldwide patterns of migration have changed, though the United States remains the most popular destination. From 1990 to 2013, the number of migrants living in the United States increased from one in six to one in five (The Pew Research Center 2013). Overall, in 2013 the United States was home to about 46 million foreign-born people, while only about 3 million U.S. citizens lived abroad. Of foreign-born citizens emigrating to the United States, 55 percent originated in Latin America and the Caribbean (Connor, Cohn, and Gonzalez-Barrera 2013).
While there are more foreign-born people residing in the United States legally, as of 2012 about 11.7 million resided here without legal status (Passel, Cohn, and Gonzalez-Barrera 2013). Most citizens agree that our national immigration policies


