
Page 1228 - Chemistry--atom first
P. 1228
1218 Appendix B
Example B11
Graphing the Dependence of y on x
x
y
1
5
2
10
3
7
4
14
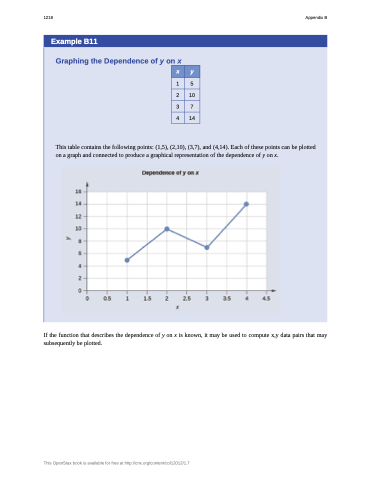
This table contains the following points: (1,5), (2,10), (3,7), and (4,14). Each of these points can be plotted on a graph and connected to produce a graphical representation of the dependence of y on x.
If the function that describes the dependence of y on x is known, it may be used to compute x,y data pairs that may subsequently be plotted.
This OpenStax book is available for free at http://cnx.org/content/col12012/1.7
