
Page 60 - College Physics For AP Courses
P. 60
48 Chapter 2 | Kinematics
Figure 2.25 Graph C of Position (y axis) vs. Time (x axis).
Object C is continually decreasing its position in the positive direction. As a result, its velocity is considered negative.
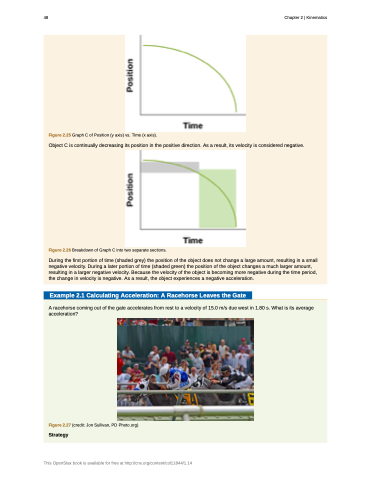
Figure 2.26 Breakdown of Graph C into two separate sections.
During the first portion of time (shaded grey) the position of the object does not change a large amount, resulting in a small negative velocity. During a later portion of time (shaded green) the position of the object changes a much larger amount, resulting in a larger negative velocity. Because the velocity of the object is becoming more negative during the time period, the change in velocity is negative. As a result, the object experiences a negative acceleration.
Example 2.1 Calculating Acceleration: A Racehorse Leaves the Gate
A racehorse coming out of the gate accelerates from rest to a velocity of 15.0 m/s due west in 1.80 s. What is its average acceleration?
Figure 2.27 (credit: Jon Sullivan, PD Photo.org) Strategy
This OpenStax book is available for free at http://cnx.org/content/col11844/1.14
