
Page 748 - College Physics For AP Courses
P. 748
736 Chapter 17 | Physics of Hearing
Table 17.2
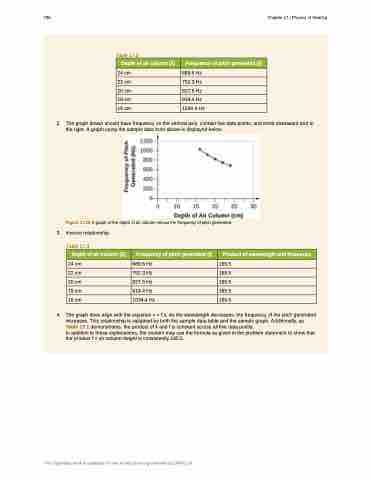
2. The graph drawn should have frequency on the vertical axis, contain five data points, and trend downward and to the right. A graph using the sample data from above is displayed below.
Figure 17.10 A graph of the depth of air column versus the frequency of pitch generated.
3. Inverse relationship.
Table 17.3
4. The graph does align with the equation v = f λ. As the wavelength decreases, the frequency of the pitch generated increases. This relationship is validated by both the sample data table and the sample graph. Additionally, as Table 17.1 demonstrates, the product of λ and f is constant across all five data points.
In addition to these explanations, the student may use the formula as given in the problem statement to show that the product f × air column height is consistently 165.5.
Depth of air column (λ) Frequency of pitch generated (f)
24 cm 689.6 Hz
22 cm 752.3 Hz
20 cm 827.5 Hz
18 cm 919.4 Hz
16 cm 1034.4 Hz
Depth of air column (λ) Frequency of pitch generated (f) Product of wavelength and frequency
24 cm 689.6 Hz 165.5
22 cm 752.3 Hz 165.5
20 cm 827.5 Hz 165.5
18 cm 919.4 Hz 165.5
16 cm 1034.4 Hz 165.5
This OpenStax book is available for free at http://cnx.org/content/col11844/1.14
