
Page 82 - College Physics For AP Courses
P. 82
70 Chapter 2 | Kinematics
Table 2.1 Results
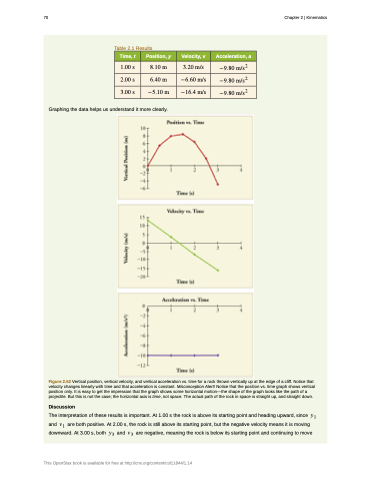
Graphing the data helps us understand it more clearly.
Figure 2.52 Vertical position, vertical velocity, and vertical acceleration vs. time for a rock thrown vertically up at the edge of a cliff. Notice that velocity changes linearly with time and that acceleration is constant. Misconception Alert! Notice that the position vs. time graph shows vertical position only. It is easy to get the impression that the graph shows some horizontal motion—the shape of the graph looks like the path of a projectile. But this is not the case; the horizontal axis is time, not space. The actual path of the rock in space is straight up, and straight down.
Discussion
The interpretation of these results is important. At 1.00 s the rock is above its starting point and heading upward, since �� and �� are both positive. At 2.00 s, the rock is still above its starting point, but the negative velocity means it is moving downward. At 3.00 s, both �� and �� are negative, meaning the rock is below its starting point and continuing to move
Time, t Position, y Velocity, v Acceleration, a
���� � ���� � ���� ���
����� ����
���� � ���� � ����� ���
����� ����
���� � ����� � ����� ���
����� ����
This OpenStax book is available for free at http://cnx.org/content/col11844/1.14
