
Page 119 - Physics Coursebook 2015 (A level)
P. 119
Chapter 7: Matter and materials
QUESTIONS
10 Figure 7.12 shows stress–strain graphs for two materials, A and B. Use the graphs to determine the Young modulus of each material.
13
In an experiment to measure the Young modulus of glass, a student draws out a glass rod to form a fibre 0.800 m in length. Using a travelling microscope, she estimates its diameter to be 0.40 mm. Unfortunately it proves impossible to obtain a series of readings for load and extension. The fibre snaps when a load of 1.00 N is hung on
the end. The student judges that the fibre extended by no more than 1 mm before it snapped.
Use these values to obtain an estimate for the Young modulus of the glass used. Explain how the actual or accepted value for the Young modulus might differ from this estimate.
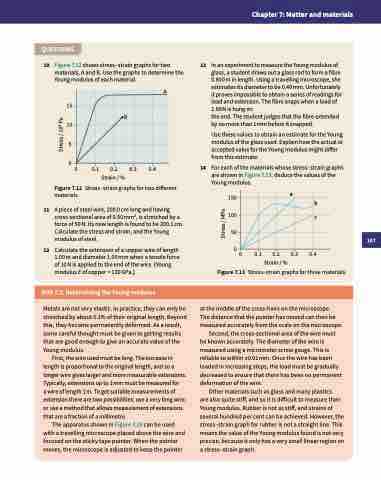
For each of the materials whose stress–strain graphs are shown in Figure 7.13, deduce the values of the Young modulus.
Figure 7.12 Stress–strain graphs for two different materials.
11 A piece of steel wire, 200.0 cm long and having cross-sectional area of 0.50 mm2, is stretched by a force of 50 N. Its new length is found to be 200.1 cm. Calculate the stress and strain, and the Young modulus of steel.
12 Calculate the extension of a copper wire of length 1.00 m and diameter 1.00 mm when a tensile force of 10 N is applied to the end of the wire. (Young modulus E of copper = 130 GPa.)
BOX 7.2: Determining the Young modulus
Metals are not very elastic. In practice, they can only be stretched by about 0.1% of their original length. Beyond this, they become permanently deformed. As a result, some careful thought must be given to getting results that are good enough to give an accurate value of the Young modulus.
First, the wire used must be long. The increase in length is proportional to the original length, and so a longer wire gives larger and more measurable extensions. Typically, extensions up to 1 mm must be measured for
a wire of length 1m. To get suitable measurements of extension there are two possibilities: use a very long wire, or use a method that allows measurement of extensions that are a fraction of a millimetre.
The apparatus shown in Figure 7.10 can be used with a travelling microscope placed above the wire and focused on the sticky tape pointer. When the pointer moves, the microscope is adjusted to keep the pointer
a
c
0 0 0.1
Figure 7.13 Stress–strain graphs for three materials.
A
15 10 5
0 0 0.1
B
0.2 Strain / %
0.3 0.4
14
150 100 50
b
0.2 0.3 0.4 Strain / %
at the middle of the cross-hairs on the microscope.
The distance that the pointer has moved can then be measured accurately from the scale on the microscope.
Second, the cross-sectional area of the wire must be known accurately. The diameter of the wire is measured using a micrometer screw gauge. This is reliable to within ±0.01 mm. Once the wire has been loaded in increasing steps, the load must be gradually decreased to ensure that there has been no permanent deformation of the wire.
Other materials such as glass and many plastics
are also quite stiff, and so it is difficult to measure their Young modulus. Rubber is not as stiff, and strains of several hundred per cent can be achieved. However, the stress–strain graph for rubber is not a straight line. This means the value of the Young modulus found is not very precise, because it only has a very small linear region on a stress–strain graph.
107
Stress / MPa
Stress / 106 Pa
