
Page 125 - Physics Coursebook 2015 (A level)
P. 125
Chapter 7: Matter and materials
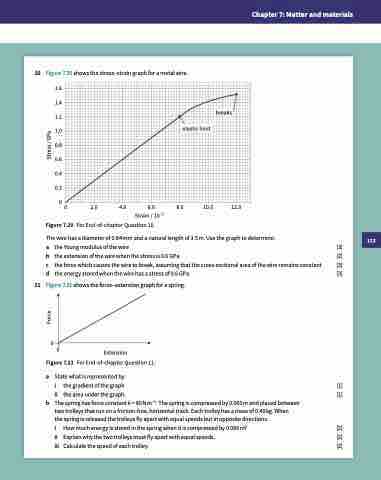
10 Figure 7.20 shows the stress–strain graph for a metal wire. 1.6
1.4 1.2 1.0 0.8 0.6 0.4 0.2
00 2.0 4.0 6.0 8.0 10.0 12.0 Strain / 10–3
Figure 7.20 For End-of-chapter Question 10.
The wire has a diameter of 0.84 mm and a natural length of 3.5 m. Use the graph to determine:
a the Young modulus of the wire [3]
b the extension of the wire when the stress is 0.6 GPa [2]
c the force which causes the wire to break, assuming that the cross-sectional area of the wire remains constant [3]
d the energy stored when the wire has a stress of 0.6 GPa. [3]
11 Figure 7.21 shows the force–extension graph for a spring.
breaks
e
lastic
limit
0
0
Extension
Figure 7.21 For End-of-chapter Question 11.
a State what is represented by:
i the gradient of the graph [1]
ii the area under the graph. [1]
b The spring has force constant k = 80 N m−1. The spring is compressed by 0.060 m and placed between two trolleys that run on a friction-free, horizontal track. Each trolley has a mass of 0.40 kg. When
the spring is released the trolleys fly apart with equal speeds but in opposite directions.
i How much energy is stored in the spring when it is compressed by 0.060 m? [2]
ii Explain why the two trolleys must fly apart with equal speeds. [2]
iii Calculate the speed of each trolley. [2]
113
Force Stress / GPa
