
Page 131 - Physics Coursebook 2015 (A level)
P. 131
Chapter 8: Electric fields
QUESTIONS
1 Which of the three field diagrams in Figure 8.7 represents:
a two positive charges repelling each other?
b two negative charges?
c two opposite charges?
i
ii
iii
Figure 8.7 Electric fields between charges – see Question 1.
2 Many molecules are described as polar; that is, they have regions that are positively or negatively charged, though they are neutral overall. Draw a diagram to show how sausage-shaped polar molecules like those shown in Figure 8.8 might realign themselves in a solid.
We can draw electric fields for other arrangements. Note the symbol for an earth, which is assumed to be uncharged (i.e. at zero volts).
Electric field strength
For an electric field, we define electric field strength E as follows:
3
Figure 8.8 Polar molecules – see Question 2.
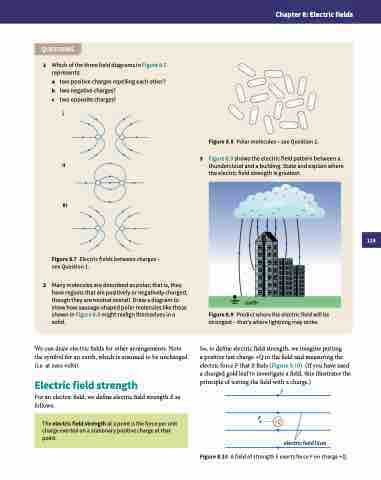
Figure 8.9 shows the electric field pattern between a thundercloud and a building. State and explain where the electric field strength is greatest.
earth
Figure 8.9 Predict where the electric field will be strongest – that’s where lightning may strike.
So, to define electric field strength, we imagine putting
a positive test charge +Q in the field and measuring the electric force F that it feels (Figure 8.10). (If you have used a charged gold leaf to investigate a field, this illustrates the principle of testing the field with a charge.)
E
F
The electric field strength at a point is the force per unit charge exerted on a stationary positive charge at that point.
+Q
electric field lines
Figure 8.10 A field of strength E exerts force F on charge +Q.
119
