
Page 192 - Physics Coursebook 2015 (A level)
P. 192
180
Cambridge International AS Level Physics
BOX 13.1: Measuring frequency
Figure 13.3 or a similar graph of displacement against time illustrates the following important definitions about waves and wave motion:
■■ The distance of a point on the wave from its undisturbed position or equilibrium position is called the displacement x.
■■ The maximum displacement of any point on the wave from its undisturbed position is called the amplitude A. The amplitude of a wave on the sea is measured in units of distance, e.g. metres. The greater the amplitude of the wave, the louder the sound or the rougher the sea!
■■ The distance from any point on a wave to the next exactly similar point (e.g. crest to crest) is called the wavelength λ (the Greek letter lambda). The wavelength of a wave on the sea is measured in units of distance, e.g. metres.
■■ The time taken for one complete oscillation of a point in a wave is called the period T. It is the time taken for a point to move from one particular position and return to that same position, moving in the same direction. It is measured in units of time, e.g. seconds..
■■ The number of oscillations per unit time of a point in a wave is called its frequency f. For sound waves, the higher the frequency of a musical note, the higher is its pitch. Frequency is measured in hertz (Hz), where 1 Hz = one oscillation per second (1 kHz = 103 Hz and 1 MHz = 106 Hz). The frequency f of a wave is the reciprocal of the period T:
f=1 T
Waves are called mechanical waves if they need a substance (medium) through which to travel. Sound is one example of such a wave. Other cases are waves on strings, seismic waves and water waves (Figure 13.4).
Some properties of typical waves are given on page 183 in Table 13.1.
Figure 13.4 The impact of a droplet on the surface of a liquid creates a vibration, which in turn gives rise to waves on the surface.
QUESTION
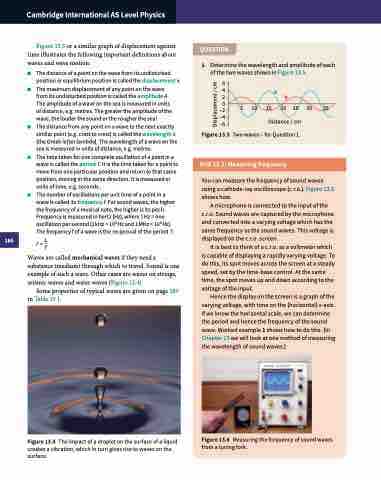
1
Determine the wavelength and amplitude of each of the two waves shown in Figure 13.5.
6
42 ab
0 –2 –4 –6
5 10 15 20 25 30 35 Distance / cm
Figure 13.5 Two waves – for Question 1.
You can measure the frequency of sound waves using a cathode-ray oscilloscope (c.r.o.). Figure 13.6 shows how.
A microphone is connected to the input of the c.r.o. Sound waves are captured by the microphone and converted into a varying voltage which has the same frequency as the sound waves. This voltage is displayed on the c.r.o. screen.
It is best to think of a c.r.o. as a voltmeter which is capable of displaying a rapidly varying voltage. To do this, its spot moves across the screen at a steady speed, set by the time-base control. At the same time, the spot moves up and down according to the voltage of the input.
Hence the display on the screen is a graph of the varying voltage, with time on the (horizontal) x-axis. If we know the horizontal scale, we can determine the period and hence the frequency of the sound wave. Worked example 1 shows how to do this. (In Chapter 15 we will look at one method of measuring the wavelength of sound waves.)
Figure 13.6 Measuring the frequency of sound waves from a tuning fork.
Displacement / cm
