
Page 300 - Physics Coursebook 2015 (A level)
P. 300
Cambridge International A Level Physics
288
QUESTION
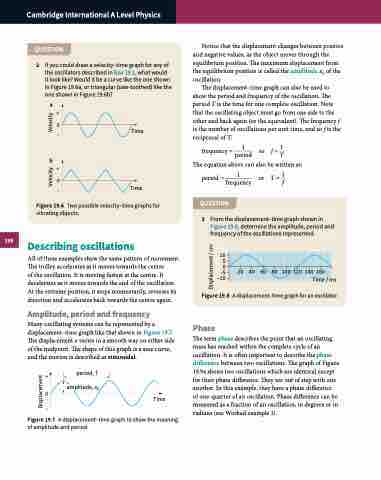
2 If you could draw a velocity–time graph for any of the oscillators described in Box 19.1, what would it look like? Would it be a curve like the one shown in Figure 19.6a, or triangular (saw-toothed) like the one shown in Figure 19.6b?
Notice that the displacement changes between positive and negative values, as the object moves through the equilibrium position. The maximum displacement from the equilibrium position is called the amplitude x0 of the oscillation.
The displacement–time graph can also be used to show the period and frequency of the oscillation. The period T is the time for one complete oscillation. Note that the oscillating object must go from one side to the other and back again (or the equivalent). The frequency f is the number of oscillations per unit time, and so f is the reciprocal of T:
a
+
0 –
b
+
0 –
Time
Time
frequency = 1 or period
f = 1 T
The equation above can also be written as:
period = 1 or frequency
QUESTION
T = 1 f
Figure 19.6 Two possible velocity–time graphs for vibrating objects.
Describing oscillations
All of these examples show the same pattern of movement. The trolley accelerates as it moves towards the centre
of the oscillation. It is moving fastest at the centre. It decelerates as it moves towards the end of the oscillation. At the extreme position, it stops momentarily, reverses its direction and accelerates back towards the centre again.
Amplitude, period and frequency
3
From the displacement–time graph shown in Figure 19.8, determine the amplitude, period and frequency of the oscillations represented.
10 5 0 –5 –10
20 40 60 80 100 120 140 160 Time / ms
Many oscillating systems can be represented by a displacement–time graph like that shown in Figure 19.7. The displacement x varies in a smooth way on either side of the midpoint. The shape of this graph is a sine curve, and the motion is described as sinusoidal.
Figure 19.8 A displacement–time graph for an oscillator.
Phase
The term phase describes the point that an oscillating mass has reached within the complete cycle of an oscillation. It is often important to describe the phase difference between two oscillations. The graph of Figure 19.9a shows two oscillations which are identical except for their phase difference. They are out of step with one another. In this example, they have a phase difference
of one-quarter of an oscillation. Phase difference can be measured as a fraction of an oscillation, in degrees or in radians (see Worked example 1).
period, T 0 amplitude, x0
–
+
Figure 19.7 A displacement–time graph to show the meaning of amplitude and period.
Time
Displacement
Displacement / cm
Velocity Velocity
