
Page 304 - Physics Coursebook 2015 (A level)
P. 304
Cambridge International A Level Physics
292
When time t = 0, the mass is at the equilibrium position and this is where it is moving fastest. Hence the velocity has its maximum value at this point. Its value is positive because at time t = 0 it is moving towards the right.
Acceleration–time (a–t) graph
Finally, the acceleration a of the oscillator at any time
can be determined from the gradient of the velocity–time graph:
a = Δν Δt
This gives a third curve of the same general form (Figure 19.15c), which shows how the acceleration a depends on time t. At the start of the oscillation, the mass is at its equilibrium position. There is no resultant force acting on it so its acceleration is zero. As it moves to the right, the restoring force acts towards the left, giving it a negative acceleration. The acceleration has its greatest value when the mass is displaced farthest from the equilibrium position. Notice that the acceleration graph is ‘upside- down’ compared with the displacement graph. This shows that:
Frequency and angular frequency
The frequency f of s.h.m. is equal to the number of oscillations per unit time. As we saw earlier, f is related to the period T by:
f = T1
We can think of a complete oscillation of an oscillator or
a cycle of s.h.m. as being represented by 2π radians. (This
is similar to a complete cycle of circular motion, where an object moves round through 2π radians.) The phase of the oscillation changes by 2π rad during one oscillation. Hence, if there are f oscillations in unit time, there must be 2πf radians in unit time. This quantity is the angular frequency of the s.h.m. and it is represented by the symbol ω (Greek letter omega).
The angular frequency ω is thus related to frequency f by the following equation:
ω=2π or T=2π Tω
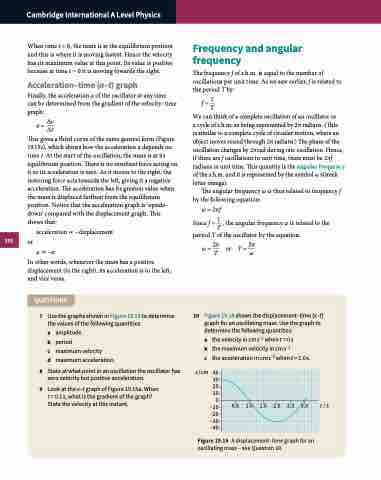
10 Figure 19.16 shows the displacement–time (x–t) graph for an oscillating mass. Use the graph to determine the following quantities:
acceleration ∝ −displacement a ∝ −x
In other words, whenever the mass has a positive displacement (to the right), its acceleration is to the left, and vice versa.
QUESTIONS
7 Use the graphs shown in Figure 19.15 to determine the values of the following quantities:
a amplitude
b period
c maximum velocity
d maximum acceleration.
8 State at what point in an oscillation the oscillator has zero velocity but positive acceleration.
9 Look at the x–t graph of Figure 19.15a. When t = 0.1 s, what is the gradient of the graph? State the velocity at this instant.
Since f = T , the angular frequency ω is related to the period T of the oscillator by the equation:
or
ω = 2πf 1
a the velocity in cms−1 when t = 0s
b the maximum velocity in cm s−1
c the acceleration in cm s−2 when t = 1.0 s.
x/cm 40 30 20 10 0 –10 –20 –30 –40
0.5 1.0
1.5 2.0
2.5 3.0
t / s
Figure 19.16 A displacement–time graph for an oscillating mass – see Question 10.
