
Page 309 - Physics Coursebook 2015 (A level)
P. 309
Chapter 19: Oscillations
passing through the equilibrium position moving to the left and again moving to the right. The potential energy is maximum at both ends of the oscillation.
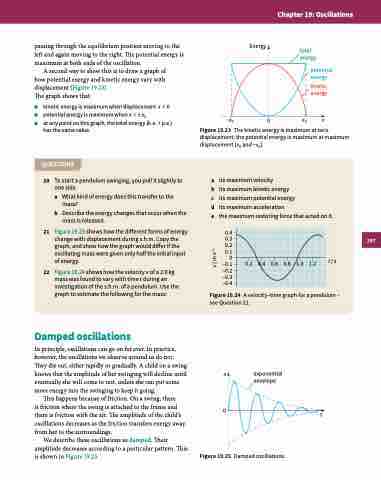
A second way to show this is to draw a graph of how potential energy and kinetic energy vary with displacement (Figure 19.23).
The graph shows that:
■■ kinetic energy is maximum when displacement x = 0
■■ potential energy is maximum when x = ± x0
■■ at any point on this graph, the total energy (k.e. + p.e.)
has the same value.
QUESTIONS
20 To start a pendulum swinging, you pull it slightly to one side.
a What kind of energy does this transfer to the mass?
b Describe the energy changes that occur when the mass is released.
21 Figure 19.23 shows how the different forms of energy change with displacement during s.h.m. Copy the graph, and show how the graph would differ if the oscillating mass were given only half the initial input of energy.
22 Figure 19.24 shows how the velocity v of a 2.0 kg mass was found to vary with time t during an investigation of the s.h.m. of a pendulum. Use the graph to estimate the following for the mass:
Damped oscillations
In principle, oscillations can go on for ever. In practice, however, the oscillations we observe around us do not. They die out, either rapidly or gradually. A child on a swing knows that the amplitude of her swinging will decline until eventually she will come to rest, unless she can put some more energy into the swinging to keep it going.
This happens because of friction. On a swing, there
is friction where the swing is attached to the frame and there is friction with the air. The amplitude of the child’s oscillations decreases as the friction transfers energy away from her to the surroundings.
We describe these oscillations as damped. Their amplitude decreases according to a particular pattern. This is shown in Figure 19.25.
Energy
total energy
potential energy
kinetic energy
–x0 0 x0 x
Figure 19.23 The kinetic energy is maximum at zero displacement; the potential energy is maximum at maximum displacement (x0 and −x0).
a its maximum velocity
b its maximum kinetic energy
c its maximum potential energy
d its maximum acceleration
e the maximum restoring force that acted on it.
0.4 0.3 0.2 0.10
–0.1 0.2 0.4 0.6 0.8 1.0 1.2 t/s –0.2
–0.3
–0.4
Figure 19.24 A velocity–time graph for a pendulum – see Question 22.
x exponential envelope
0
Figure 19.25 Damped oscillations.
t
297
v / m s–1
