
Page 338 - Physics Coursebook 2015 (A level)
P. 338
Cambridge International A Level Physics
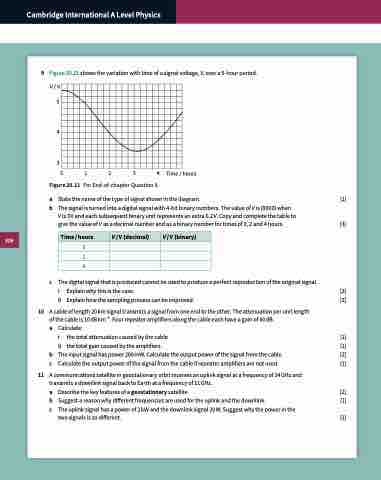
9 Figure 20.21 shows the variation with time of a signal voltage, V, over a 5-hour period. V /V
5
4
3
Figure 20.21 For End-of-chapter Question 9.
0 1 2 3 4
Time / hours
a State the name of the type of signal shown in the diagram. [1]
b The signal is turned into a digital signal with 4-bit binary numbers. The value of V is (0000) when
V is 3 V and each subsequent binary unit represents an extra 0.2 V. Copy and complete the table to
give the value of V as a decimal number and as a binary number for times of 0, 2 and 4 hours. [3]
0
2
4
c The digital signal that is produced cannot be used to produce a perfect reproduction of the original signal.
i Explain why this is the case. [2]
ii Explain how the sampling process can be improved. [2]
10 A cable of length 20 km signal transmits a signal from one end to the other. The attenuation per unit length of the cable is 10 dB km−1. Four repeater amplifiers along the cable each have a gain of 40 dB.
a Calculate:
i the total attenuation caused by the cable [1]
ii the total gain caused by the amplifiers. [1]
b The input signal has power 200 mW. Calculate the output power of the signal from the cable. [2]
c Calculate the output power of the signal from the cable if repeater amplifiers are not used. [1]
11 A communications satellite in geostationary orbit receives an uplink signal at a frequency of 14 GHz and transmits a downlink signal back to Earth at a frequency of 11 GHz.
a Describe the key features of a geostationary satellite. [2]
b Suggest a reason why different frequencies are used for the uplink and the downlink. [1]
c The uplink signal has a power of 2 kW and the downlink signal 20 W. Suggest why the power in the
two signals is so different. [1]
Time / hours
V / V (decimal)
V / V (binary)
326
