
Page 34 - Physics Coursebook 2015 (A level)
P. 34
22
Cambridge International AS Level Physics
WORKED EXAMPLES (continued)
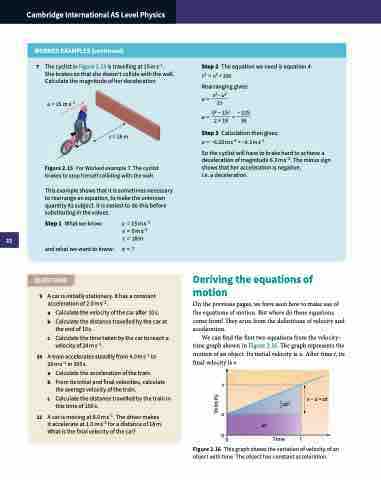
7 The cyclist in Figure 2.15 is travelling at 15 m s−1. She brakes so that she doesn’t collide with the wall. Calculate the magnitude of her deceleration.
u = 15 m s–1
s = 18 m
Figure 2.15 For Worked example 7. The cyclist brakes to stop herself colliding with the wall.
This example shows that it is sometimes necessary to rearrange an equation, to make the unknown quantity its subject. It is easiest to do this before substituting in the values.
Step2 Theequationweneedisequation4: v2 = u2 + 2as
Rearranging gives: a= v2−u2
2s
a= 02−152 = −225
2 × 18 36
Step3 Calculationthengives:
a = −6.25ms−2 ≈ −6.3ms−2
So the cyclist will have to brake hard to achieve a deceleration of magnitude 6.3 m s−2. The minus sign shows that her acceleration is negative,
i.e. a deceleration.
Step1 Whatweknow: andwhatwewanttoknow:
QUESTIONS
u=15ms−1 v = 0ms−1 s = 18m
a = ?
9 A car is initially stationary. It has a constant acceleration of 2.0 m s−2.
a Calculate the velocity of the car after 10 s.
b Calculate the distance travelled by the car at
theendof10s.
c Calculate the time taken by the car to reach a velocity of 24 m s−1.
10 A train accelerates steadily from 4.0 m s−1 to 20ms−1 in 100s.
a Calculate the acceleration of the train.
b From its initial and final velocities, calculate
the average velocity of the train.
c Calculate the distance travelled by the train in this time of 100 s.
11 A car is moving at 8.0 m s−1. The driver makes it accelerate at 1.0 m s−2 for a distance of 18 m. What is the final velocity of the car?
Deriving the equations of motion
On the previous pages, we have seen how to make use of the equations of motion. But where do these equations come from? They arise from the definitions of velocity and acceleration.
We can find the first two equations from the velocity– time graph shown in Figure 2.16. The graph represents the motion of an object. Its initial velocity is u. After time t, its final velocity is v.
v
u
00 Time
Figure 2.16 This graph shows the variation of velocity of an object with time. The object has constant acceleration.
ut
1 at2 2
v – u = at
t
Velocity
