
Page 341 - Physics Coursebook 2015 (A level)
P. 341
Chapter 21: Thermal physics
Energy changes
Energy must be supplied to raise the temperature of a solid, to melt it, to heat the liquid and to boil it. Where does this energy go? It is worth taking a close look at
a single change of state and thinking about what is happening on the atomic scale. Figure 21.3a shows a suitable arrangement. A test tube containing octadecanoic acid (a white, waxy substance at room temperature) is warmed in a water bath. At 80 °C, the substance is a clear liquid. The tube is then placed in a rack and allowed
to cool. Its temperature is monitored, either with a thermometer or with a temperature probe and datalogger. Figure 21.3b shows typical results.
100
BC
F DE
Time
a to datalogger temperature
probe
octadecanoic acid
b
A melting
point
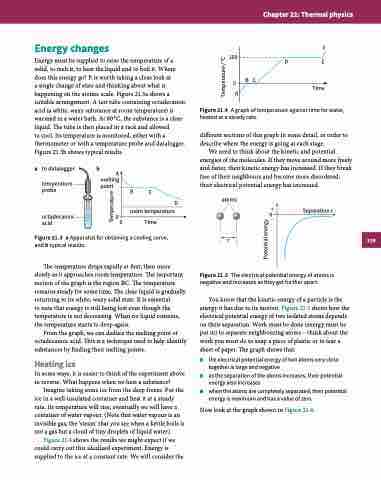
Figure 21.4 A graph of temperature against time for water, heated at a steady rate.
different sections of this graph in some detail, in order to describe where the energy is going at each stage.
We need to think about the kinetic and potential energies of the molecules. If they move around more freely and faster, their kinetic energy has increased. If they break free of their neighbours and become more disordered, their electrical potential energy has increased.
0 A
0 0
D room temperature
Time
atoms
r
+ Separation r 0–
B
C
Figure 21.3 a Apparatus for obtaining a cooling curve, and b typical results.
The temperature drops rapidly at first, then more slowly as it approaches room temperature. The important section of the graph is the region BC. The temperature remains steady for some time. The clear liquid is gradually returning to its white, waxy solid state. It is essential
to note that energy is still being lost even though the temperature is not decreasing. When no liquid remains, the temperature starts to drop again.
From the graph, we can deduce the melting point of octadecanoic acid. This is a technique used to help identify substances by finding their melting points.
Heating ice
In some ways, it is easier to think of the experiment above in reverse. What happens when we heat a substance?
Imagine taking some ice from the deep freeze. Put the ice in a well-insulated container and heat it at a steady rate. Its temperature will rise; eventually we will have a container of water vapour. (Note that water vapour is an invisible gas; the ‘steam’ that you see when a kettle boils is not a gas but a cloud of tiny droplets of liquid water.)
Figure 21.4 shows the results we might expect if we could carry out this idealised experiment. Energy is supplied to the ice at a constant rate. We will consider the
Figure 21.5 The electrical potential energy of atoms is negative and increases as they get further apart.
You know that the kinetic energy of a particle is the energy it has due to its motion. Figure 21.5 shows how the electrical potential energy of two isolated atoms depends on their separation. Work must be done (energy must be put in) to separate neighbouring atoms – think about the work you must do to snap a piece of plastic or to tear a sheet of paper. The graph shows that:
■■ the electrical potential energy of two atoms very close together is large and negative
■■ as the separation of the atoms increases, their potential energy also increases
■■ when the atoms are completely separated, their potential energy is maximum and has a value of zero.
Now look at the graph shown in Figure 21.4.
329
Potential energy
Temperature
Temperature / °C
