
Page 46 - Physics Coursebook 2015 (A level)
P. 46
Cambridge International AS Level Physics
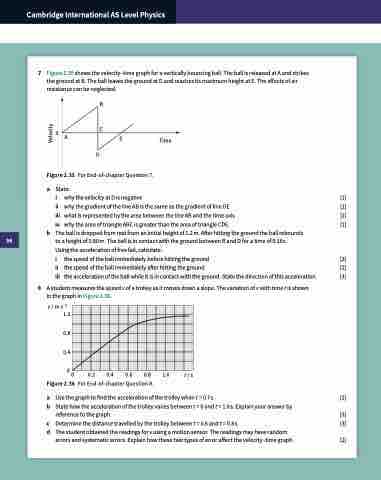
7 Figure 2.35 shows the velocity–time graph for a vertically bouncing ball. The ball is released at A and strikes the ground at B. The ball leaves the ground at D and reaches its maximum height at E. The effects of air resistance can be neglected.
B
C
E
0A
D
Time
a State:
i why the velocity at D is negative [1]
ii why the gradient of the line AB is the same as the gradient of line DE [1]
iii whatisrepresentedbytheareabetweenthelineABandthetimeaxis [1]
iv whytheareaoftriangleABCisgreaterthantheareaoftriangleCDE. [1]
b The ball is dropped from rest from an initial height of 1.2 m. After hitting the ground the ball rebounds to a height of 0.80 m. The ball is in contact with the ground between B and D for a time of 0.16 s.
Using the acceleration of free fall, calculate:
i the speed of the ball immediately before hitting the ground [2]
ii the speed of the ball immediately after hitting the ground [2]
iii the acceleration of the ball while it is in contact with the ground. State the direction of this acceleration. [3]
8 A student measures the speed v of a trolley as it moves down a slope. The variation of v with time t is shown in the graph in Figure 2.36.
Figure 2.35 For End-of-chapter Question 7.
v / m s–1 1.2
0.8 0.4
0 0 0.2 0.4 0.6 0.8 1.0
Figure 2.36 For End-of-chapter Question 8.
t / s
a Use the graph to find the acceleration of the trolley when t = 0.7 s. [2]
b State how the acceleration of the trolley varies between t = 0 and t = 1.0 s. Explain your answer by
reference to the graph. [3]
c Determine the distance travelled by the trolley between t = 0.6 and t = 0.8 s. [3]
d The student obtained the readings for v using a motion sensor. The readings may have random
errors and systematic errors. Explain how these two types of error affect the velocity–time graph. [2]
34
Velocity
