
Page 487 - Physics Coursebook 2015 (A level)
P. 487
Chapter 30: Quantum physics
QUESTIONS
12 Electromagnetic waves of wavelength
2.4 × 10⁻⁷ m are incident on the surface of a metal whose work function is 2.8 × 10⁻¹⁹ J.
a Calculate the energy of a single photon.
b Calculate the maximum kinetic energy of
electrons released from the metal.
c Determine the maximum speed of the emitted photoelectrons.
13 When electromagnetic radiation of wavelength 2000 nm is incident on a metal surface, the maximum kinetic energy of the electrons released is found to be 4.0 × 10⁻²⁰ J. Determine the work function of the metal in joules (J).
Line spectra
a
b
c
d
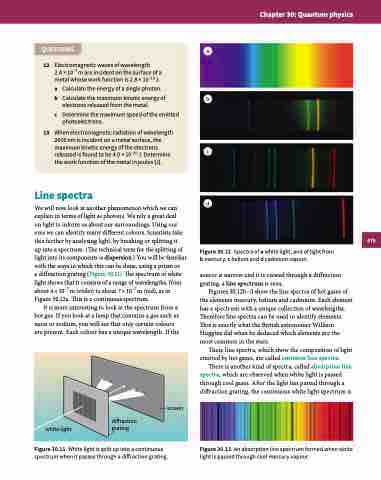
Figure 30.12 Spectra of a white light, and of light from b mercury, c helium and d cadmium vapour.
source is narrow and it is viewed through a diffraction grating, a line spectrum is seen.
Figures 30.12b–d show the line spectra of hot gases of the elements mercury, helium and cadmium. Each element has a spectrum with a unique collection of wavelengths. Therefore line spectra can be used to identify elements. This is exactly what the British astronomer William Huggins did when he deduced which elements are the most common in the stars.
These line spectra, which show the composition of light emitted by hot gases, are called emission line spectra.
There is another kind of spectra, called absorption line spectra, which are observed when white light is passed through cool gases. After the light has passed through a diffraction grating, the continuous white light spectrum is
Figure 30.13 An absorption line spectrum formed when white light is passed through cool mercury vapour.
We will now look at another phenomenon which we can explain in terms of light as photons. We rely a great deal
on light to inform us about our surroundings. Using our eyes we can identify many different colours. Scientists take this further by analysing light, by breaking or splitting it
up into a spectrum. (The technical term for the splitting of light into its components is dispersion.) You will be familiar with the ways in which this can be done, using a prism or
a diffraction grating (Figure 30.11). The spectrum of white light shows that it consists of a range of wavelengths, from about 4 × 10⁻⁷ m (violet) to about 7 × 10⁻⁷ m (red), as in Figure 30.12a. This is a continuous spectrum.
It is more interesting to look at the spectrum from a hot gas. If you look at a lamp that contains a gas such as neon or sodium, you will see that only certain colours are present. Each colour has a unique wavelength. If the
white light
diffraction grating
Figure 30.11 White light is split up into a continuous spectrum when it passes through a diffraction grating.
screen
475
