
Page 511 - Physics Coursebook 2015 (A level)
P. 511
Chapter 31: Nuclear physics
QUESTIONS
12 A sample of carbon-15 initially contains 500 000 undecayed nuclei. The decay constant for this isotope of carbon is 0.30 s−1. Determine the initial activity of the sample.
13 A small sample of radium gives a received count rate of 20 counts per minute in a detector. It is known that the counter detects only 10% of the decays from the sample. The sample contains 1.5 × 10⁹ undecayed nuclei. Determine the decay constant of this form of radium.
14 A radioactive sample is known to emit α-, β- and γ-radiations. Suggest four reasons why the count rate measured by a Geiger counter placed next to this sample would be lower than the activity of the sample.
Decay graphs and equations
The activity of a radioactive substance gradually diminishes as time goes by. The atomic nuclei emit radiation and become different substances. The pattern
of radioactive decay is an example of a very important pattern found in many different situations, a pattern called exponential decay. Figure 31.9 shows the decay graphs for three different isotopes, each with a different rate of decay.
00 Time
Figure 31.9 Some radioactive materials decay faster than others.
Although the three graphs look different, they all have something in common − their shape. They are curved lines having a special property. If you know what is meant by the half-life of a radioisotope, then you will understand what is special about the shape of these curves.
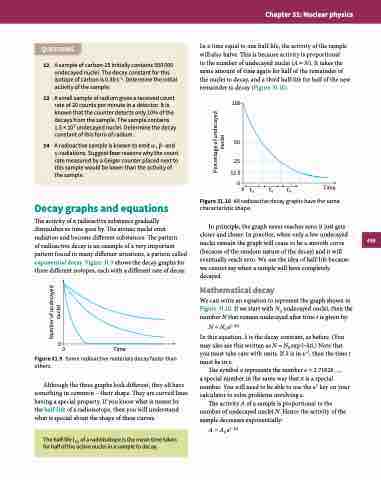
In a time equal to one half-life, the activity of the sample will also halve. This is because activity is proportional
to the number of undecayed nuclei (A ∝ N). It takes the same amount of time again for half of the remainder of the nuclei to decay, and a third half-life for half of the new remainder to decay (Figure 31.10).
100
50
25 12.5
00 t1⁄2
Figure 31.10 All radioactive decay graphs have the same
characteristic shape.
In principle, the graph never reaches zero; it just gets closer and closer. In practice, when only a few undecayed nuclei remain the graph will cease to be a smooth curve (because of the random nature of the decay) and it will eventually reach zero. We use the idea of half-life because we cannot say when a sample will have completely decayed.
Mathematical decay
We can write an equation to represent the graph shown in Figure 31.10. If we start with N0 undecayed nuclei, then the number N that remain undecayed after time t is given by:
N = N0 e(−λt)
In this equation, λ is the decay constant, as before. (You may also see this written as N = N0 exp (−λt).) Note that you must take care with units. If λ is in s−1, then the time t must be in s.
The symbol e represents the number e = 2.71828...,
a special number in the same way that π is a special number. You will need to be able to use the ex key on your calculator to solve problems involving e.
The activity A of a sample is proportional to the number of undecayed nuclei N. Hence the activity of the sample decreases exponentially:
A = A0 e(−λt)
t1⁄2 t1⁄2
Time
The half-life t1/2 of a radioisotope is the mean time taken for half of the active nuclei in a sample to decay.
499
Number of undecayed nuclei
Percentage of undecayed nuclei
