Page 635 - Understanding Psychology
P. 635
 Skills Handbook
 Interpreting Statistics
Statistics are mathematical processes used to organize, summarize, and analyze data collected by researchers. Interpreting statistics helps us use data to support a generalization or conclusion.
 Learn the Skill
There are three things to consider when in- terpreting statistics: nonrepresentative sample, correlation, and statistical significance.
1. Suppose that a
psychologist wants
to test the fol-
lowing hypothesis:
Teenagers who eat
large breakfasts have
high grades. Since it
is impossible to
study all teenagers,
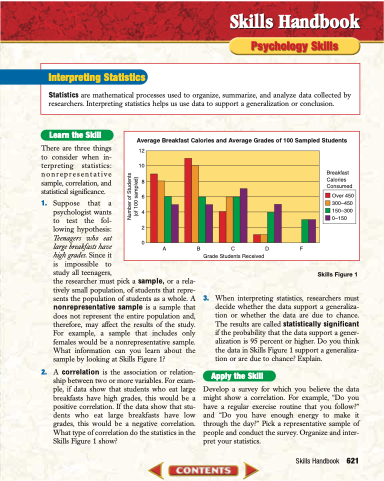
the researcher must pick a sample, or a rela- tively small population, of students that repre- sents the population of students as a whole. A nonrepresentative sample is a sample that does not represent the entire population and, therefore, may affect the results of the study. For example, a sample that includes only females would be a nonrepresentative sample. What information can you learn about the sample by looking at Skills Figure 1?
2. A correlation is the association or relation- ship between two or more variables. For exam- ple, if data show that students who eat large breakfasts have high grades, this would be a positive correlation. If the data show that stu- dents who eat large breakfasts have low grades, this would be a negative correlation. What type of correlation do the statistics in the Skills Figure 1 show?
Skills Figure 1
3. When interpreting statistics, researchers must decide whether the data support a generaliza- tion or whether the data are due to chance. The results are called statistically significant if the probability that the data support a gener- alization is 95 percent or higher. Do you think the data in Skills Figure 1 support a generaliza- tion or are due to chance? Explain.
Apply the Skill
Develop a survey for which you believe the data might show a correlation. For example, “Do you have a regular exercise routine that you follow?” and “Do you have enough energy to make it through the day?” Pick a representative sample of people and conduct the survey. Organize and inter- pret your statistics.
Average Breakfast Calories and Average Grades of 100 Sampled Students
12 10 8 6 4 2 0
Breakfast Calories Consumed
Over 450 300–450 150–300 0–150
              ABCDF Grade Students Received
Psychology Skills
   Skills Handbook 621
    Number of Students (of 100 sampled)


