Page 346 - Geosystems An Introduction to Physical Geography 4th Canadian Edition
P. 346
 310 part II The Water, Weather, and Climate Systems
  405
400
395
390
385
380
375
370
365
360
355
350
345
340
335
330
325
320
315 (b) The Mauna Loa Observatory is located on Mauna Loa
 May 2014 (402 ppm)
 310
1955 1960 1965 1970 1975 1980 1985 1990 1995 2000 2005 2010 2015
Year
(a) Fifty-five years of CO2 data measured through May 2014.
volcano at 3397 m on Hawai‘i’s Big Island.
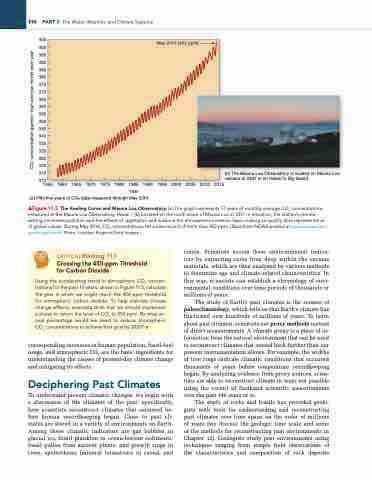
▲Figure 11.5 The Keeling Curve and Mauna Loa Observatory. (a) The graph represents 57 years of monthly average CO2 concentrations measured at the Mauna loa Observatory, Hawai‘i. (b) located on the north slope of Mauna loa at 3397 m elevation, the station’s remote setting minimizes pollution and the effects of vegetation and is above the atmospheric inversion layer, making air-quality data representative of global values. During May 2014, CO2 concentrations set a new record of more than 402 ppm. [Data from nOaa posted at www.esrl.noaa.gov/ gmd/ccgg/trends/. Photo: Jonathan kingston/getty images.]
 CrITICALthinking 11.1
Crossing the 450-ppm Threshold for Carbon Dioxide
Using the accelerating trend in atmospheric CO2 concen- trations for the past 10 years, shown in Figure 11.5, calculate the year in which we might reach the 450-ppm threshold for atmospheric carbon dioxide. To help stabilize climate change effects, scientists think that we should implement policies to return the level of CO2 to 350 ppm. By what an- nual percentage would we need to reduce atmospheric CO2 concentrations to achieve that goal by 2020? •
corresponding increases in human population, fossil-fuel usage, and atmospheric CO2 are the basic ingredients for understanding the causes of present-day climate change and mitigating its effects.
Deciphering Past Climates
To understand present climatic changes, we begin with a discussion of the climates of the past; specifically, how scientists reconstruct climates that occurred be- fore human recordkeeping began. Clues to past cli- mates are stored in a variety of environments on Earth. Among these climatic indicators are gas bubbles in glacial ice, fossil plankton in ocean-bottom sediments, fossil pollen from ancient plants, and growth rings in trees, speleothems (mineral formations in caves), and
corals. Scientists access these environmental indica- tors by extracting cores from deep within the various materials, which are then analyzed by various methods to determine age and climate-related characteristics. In this way, scientists can establish a chronology of envi- ronmental conditions over time periods of thousands or millions of years.
The study of Earth’s past climates is the science of paleoclimatology, which tells us that Earth’s climate has fluctuated over hundreds of millions of years. To learn about past climates, scientists use proxy methods instead of direct measurements. A climate proxy is a piece of in- formation from the natural environment that can be used to reconstruct climates that extend back further than our present instrumentation allows. For example, the widths of tree rings indicate climatic conditions that occurred thousands of years before temperature recordkeeping began. By analyzing evidence from proxy sources, scien- tists are able to reconstruct climate in ways not possible using the record of firsthand scientific measurements over the past 140 years or so.
The study of rocks and fossils has provided geolo- gists with tools for understanding and reconstructing past climates over time spans on the order of millions of years (we discuss the geologic time scale and some of the methods for reconstructing past environments in Chapter 12). Geologists study past environments using techniques ranging from simple field observations of the characteristics and composition of rock deposits
CO2 concentration (ppmv)—high and low month each year


