Page 358 - Geosystems An Introduction to Physical Geography 4th Canadian Edition
P. 358
 322
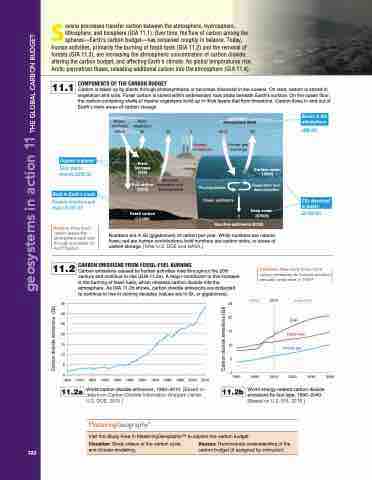
 Several processes transfer carbon between the atmosphere, hydrosphere, lithosphere, and biosphere (GIA 11.1). Over time, the flow of carbon among the spheres—Earth’s carbon budget—has remained roughly in balance. Today, human activities, primarily the burning of fossil fuels (GIA 11.2) and the removal of forests (GIA 11.3), are increasing the atmospheric concentration of carbon dioxide, altering the carbon budget, and affecting Earth's climate. As global temperatures rise, Arctic permafrost thaws, releasing additional carbon into the atmosphere (GIA 11.4).
11.1
COMPONENTS OF THE CARBON BUDGET
Carbon is taken up by plants through photosynthesis or becomes dissolved in the oceans. On land, carbon is stored in vegetation and soils. Fossil carbon is stored within sedimentary rock strata beneath Earth's surface. On the ocean floor, the carbon-containing shells of marine organisms build up in thick layers that form limestone. Carbon flows in and out of Earth’s main areas of carbon storage.
  Photo- synthesis
120+3
Plant respiration
60
Plant biomass (550)
Soil carbon (2300)
Fossil carbon (10 000)
Atmosphere (800)
 60
Microbial respiration and decomposition
9 90+2
Human emissions
90
(800 Gt)
    Organic material:
Soils, plants, animals (2850 Gt)
Rock in Earth’s crust:
Primarily limestone and shale (16 000 Gt)
Analyze: How much carbon leaves the atmosphere each year through processes on land? Explain.
Photosynthesis Ocean sediments
Surface ocean (1000)
Respiration and decomposition
Deep ocean (37000)
Air-sea gas exchange
      2
(38 000 Gt)
Reactive sediments (6000)
  Numbers are in Gt (gigatonnes) of carbon per year. White numbers are natural flows; red are human contributions; bold numbers are carbon sinks, or areas of carbon storage. [After U.S. DOE and NASA.]
 CARBON EMISSIONS FROM FOSSIL-FUEL BURNING
Carbon emissions caused by human activities rose throughout the 20th century and continue to rise (GIA 11.2a). A major contributor to this increase is the burning of fossil fuels, which releases carbon dioxide into the atmosphere. As GIA 11.2b shows, carbon dioxide emissions are projected to continue to rise in coming decades (values are in Gt, or gigatonnes).
35 25
30
25
20 15 15
10
Calculate: How many times more carbon emissions do humans produce annually today than in 1950?
11.2
5
0
1900 1910 1920 1930 1940 1950 1960 1970 1980 1990 2000 2010
World carbon dioxide emissions, 1900–2010. [Based on data from Carbon Dioxide Information Analysis Center, U.S. DOE, 2013.]
20
10 5 0
1990
2000 2010
history 2010
projections
Coal
Liquid fuels
Natural gas
2020 2030 2040
Gases in the atmosphere:
 CO2 dissolved in water:
    World energy-related carbon dioxide emissions by fuel type, 1990–2040. [Based on U.S. EIA, 2013.]
  11.2a
11.2b
    Visit the Study Area in MasteringGeographyTM to explore the carbon budget.
Visualize: Study videos of the carbon cycle Assess: Demonstrate understanding of the and climate modelling. carbon budget (if assigned by instructor).
   Carbon dioxide emissions (Gt)
Carbon dioxide emissions (Gt)
geosystems in action 11THE GLOBAL CARBOn BuDGET


