Page 373 - Geosystems An Introduction to Physical Geography 4th Canadian Edition
P. 373
Chapter 11 Climate Change 337
   Alaska
Sensitivity Index
0 –4.9 Low
5 –14.9 Moderate
≥ 15.0 High
U.S.A
120° 110°
100°
90°
80° 70°
150°
120° 90° 60° 30°
States, Mumbai and Kolkata in India, and Shanghai in China, where large numbers of people will have to leave coastal areas. The social and economic consequences will especially affect small, low-elevation island states. For example, in Malé, the capital city of the Maldives archi- pelago in the Indian Ocean, over 100000 people reside behind a sea wall at elevations of about 2.0 to 2.4 m. If the high sea-level rise scenarios occur by 2100, major portions of this island will be inundated. The low-lying country of Bangladesh has been cited by the World Bank Group as a “potential impact hotspot,” with the livelihoods and security of tens of millions of people at risk. National and international migration—a flood of environmental refu- gees driven by climate change—would be expected to continue for decades. Sea-level increases will continue beyond 2100, even if greenhouse gas concentrations were to be stabilized today. To see an interactive map of the ef- fects of rising sea level on different areas of the world, go to geology.com/sea-level-rise/.
The Path Ahead
Over 25 years ago, in an April 1988 article in Scientific American, climatologists described the climatic condition:
The world is warming. Climatic zones are shifting. Gla- ciers are melting. Sea level is rising. These are not hypo- thetical events from a science fiction movie; these changes and others are already taking place, and we expect them to accelerate over the next years as the amounts of carbon dioxide, methane, and other trace gases accumulating in the atmosphere through human activities increase.
In 1997, under the evolving threat of accelerating global warming and associated changes in climate, 84 coun- tries signed the Kyoto Protocol at a climate conference in Kyoto, Japan, a legally binding international agree- ment under the United Nations Framework Convention
Arctic Ocean
Beaufort Sea
Greenland
60°
55° 50°
45° 40°
60°
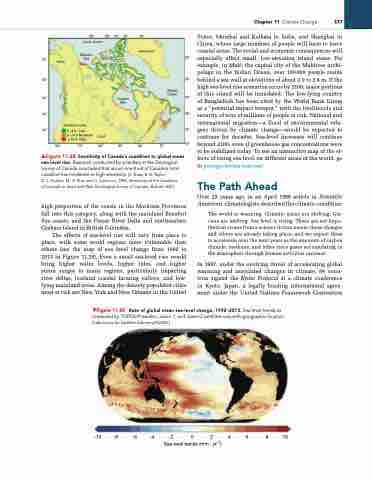
high proportion of the coasts in the Maritime Provinces fall into this category, along with the mainland Beaufort Sea coasts, and the Fraser River Delta and northeastern Graham Island in British Columbia.
The effects of sea-level rise will vary from place to place, with some world regions more vulnerable than others (see the map of sea level change from 1992 to 2013 in Figure 11.29). Even a small sea-level rise would bring higher water levels, higher tides, and higher storm surges to many regions, particularly impacting river deltas, lowland coastal farming valleys, and low- lying mainland areas. Among the densely populated cities most at risk are New York and New Orleans in the United
60°
55° 50°
45° 40°
▲Figure 11.28 Sensitivity of Canada’s coastlines to global mean sea level rise. research conducted by scientists at the geological Survey of Canada concluded that about one-third of Canada’s total coastline has moderate or high sensitivity. [J. Shaw, r. B. Taylor,
D. l. Forbes, M.-H. ruiz, and S. Solomon, 1998, Sensitivity of the Coastline of Canada to Sea-Level Rise, geological Survey of Canada, Bulletin 505.]
Hudson Bay
Atlantic Ocean
▼Figure 11.29 rate of global mean sea-level change, 1992–2013. Sea level trends as measured by TOPEX/Poseidon, Jason-1, and Jason-2 satellites vary with geographic location. [laboratory for Satellite altimetry/nOaa.]
 -10 -8 -6 -4 -2 0 2 4 6 8 10 Sea level trends (mm · yr–1)


