Page 377 - Geosystems An Introduction to Physical Geography 4th Canadian Edition
P. 377
 aQuantitativeSOlUTiOn Climate-Change Index
Is it possible to reduce the relative magnitude of complex climate changes into just one number, analogous to a stock market index? A group of scientists representing the International Geosphere Biosphere Program has done just that by creating the IGBP Climate-Change Index (www.igbp.net). The index combines data for four key climate change indicators: global average tempera- ture, atmospheric CO2 concentration, global mean sea level, and Arctic sea ice cover.
The index is calculated annually and can be summed over a number of consecutive years to show accumulated change over time. All but four years in the past three decades had positive index values. Cumulatively, the unequivocal increasing trend in the index indicates a persistent shift away from relatively stable climate.
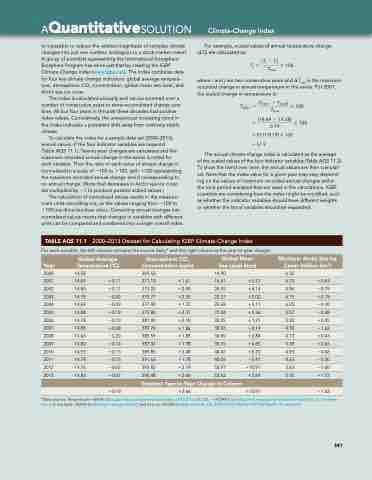
To calculate the index for a sample data set (2000–2013), annual values of the four indicator variables are required
(Table AQS 11.1). Year-to-year changes are calculated and the maximum recorded annual change in the series is noted for each variable. Then the ratio of each value of annual change is normalized to a scale of −100 to +100, with +100 representing the maximum recorded annual change and 0 corresponding to no annual change. (Note that decreases in Arctic sea ice cover are multiplied by −1 to produce positive scaled values.)
The calculation of normalized values results in the measure- ment units cancelling out, so the values ranging from −100 to +100 are dimensionless ratios. Converting annual changes into normalized values means that changes in variables with different units can be compared and combined into a single overall index.
For example, scaled values of annual temperature change (ΔTj) are calculated as:
(Tj - Ti)
Tj= Tmax *100
where i and j are two consecutive years and ΔTmax is the maximum recorded change in annual temperature in the series. For 2001, the scaled change in temperature is:
TABLE AQS 11.1 2000–2013 Dataset for Calculating IGBP Climate-Change Index
For each variable, the left column contains the source data,* and the right column is the year-to-year change.
(T -T )
T2001 = 2001 2000 * 100
 Tmax
= (14.69 - 14.58) * 100
 0.19
= (0.11/0.19) × 100
= 57.9
The annual climate-change index is calculated as the average
of the scaled values of the four indicator variables (Table AQS 11.2). To show the trend over time, the annual values are then cumulat- ed. Note that the index value for a given year may vary, depend- ing on the values of maximum recorded annual changes within the time period analyzed that are used in the calculations. IGBP scientists are considering how the index might be modified, such as whether the indicator variables should have different weights or whether the list of variables should be expanded.
  Year
Global Average Temperature (°C)
Atmospheric CO2 Concentration (ppm)
Global Mean Sea Level (mm)
Minimum Arctic Sea Ice Cover (million km2)
2000
 14.58
  369.52
  10.90
  6.32
  2001 14.69 2003 14.78 2005 14.88 2007 14.86 2009 14.80 2011 14.78 2013 14.83
+0.11 371.13 +1.61 −0.02 375.77 +2.55 +0.19 379.80 +2.31 +0.08 383.76 +1.86 +0.14 387.37 +1.78 −0.15 391.63 +1.78 +0.07 396.48 +2.66
16.41 +5.51 6.75 22.57 +2.02 6.15 31.04 +5.36 5.57 32.06 −0.19 4.30 39.75 +4.85 5.39 40.06 −0.41 4.63 53.62 +2.64 5.35
+0.43 +0.19 −0.48 −1.62 +0.66 −0.30 +1.72
 2002
  14.80
  +0.11
  373.22
  +2.09
  20.55
  +4.14
  5.96
  −0.79
  2004
  14.69
  −0.09
  377.49
  +1.72
  25.68
  +3.11
  6.05
  −0.10
  2006
  14.78
  −0.10
  381.90
  +2.10
  32.25
  +1.21
  5.92
  +0.35
  2008
  14.66
  −0.20
  385.59
  +1.83
  34.90
  +2.84
  4.73
  +0.43
  2010
  14.93
  +0.13
  389.85
  +2.48
  40.47
  +0.72
  4.93
  −0.46
  2012
  14.76
  −0.02
  393.82
  +2.19
  50.97
  +10.91
  3.63
  −1.00
  Greatest Year-to-Year Change in Column
  +0.19
  +2.66
  +10.91
  −1.62
 *Data sources: Temperature—naSa (data.giss.nasa.gov/gistemp/tabledata_v3/GLB.Ts.txt); CO2 — nOaa (ftp://aftp.cmdl.noaa.gov/products/trends/co2/co2_annmean_ mlo.txt); Sea level—naSa (sealevel.jpl.nasa.gov/data/); and Sea ice—nOaa (sidads.colorado.edu/DATASETS/NOAA/G02135/Sep/N_09_area.txt).
341


