Page 646 - Geosystems An Introduction to Physical Geography 4th Canadian Edition
P. 646
 610 part IV Soils, ecosystems, and Biomes
  TABlE 19.1 Net Primary Productivity and Plant Biomass on Earth
 Ecosystem
 Area (106 km2)
 Net Area (g·m−2·yr−1) Normal Range
 Primary per Unit Mean
 World Net Biomass (109 tonnes·yr−1)
  Tropical rain forest 17.0 Temperate evergreen forest 5.0 Boreal forest 12.0 Savanna 15.0 Tundra and alpine region 8.0 extreme desert, rock, sand, ice 24.0 Swamp and marsh 2.0
Total continental 149.0
Upwelling zones 0.4 algal beds and reefs 0.6 Total marine 361.0
Grand total 510.0
1000–3500 600–2500 400–2000 200–2000
10–400 0–10 800–3500
—
400–1000 500–4000
—
—
2200 37.4 1300 6.5 800 9.6 900 13.5 140 1.1 3 0.1 2000 4.0 773 115.2 500 0.2 2500 1.6 152 55.0
333 170.2
 Tropical seasonal forest
  7.5
  1000–2500
  1600
  12.0
   Temperate deciduous forest
  7.0
  600–2500
  1200
  8.4
  Woodland and shrubland
  8.5
  250–1200
  700
  6.0
  Temperate grassland
  9.0
  200–1500
  600
  5.4
  Desert and semidesert scrub
  18.0
  10–250
  90
  1.6
  Cultivated land
  14.0
  100–3500
  650
  9.1
  lake and stream
  2.0
  100–1500
  250
  0.5
  Open ocean
  332.0
  2–400
  125
  41.5
  Continental shelf
  26.6
  200–600
  360
  9.6
  estuaries
  1.4
  200–3500
  1500
  2.1
   Source: From Whittaker, robert C., Communities and Ecosystems 2nd ed., © 1975, p. 224. reprinted and electronically reproduced by permission of Pearson education, inc., Upper Saddle river, new Jersey.
abundant precipitation with high productivity adja- cent to the equator and reduced precipitation with low productivity in the subtropical deserts. Even though deserts receive high amounts of solar radiation, water availability and other controlling factors, such as soil conditions, limit productivity.
In temperate and high latitudes, the rate at which car- bon is fixed by vegetation varies seasonally. It increases in spring and summer as plants flourish with increas- ing solar input and, in some areas, with more available (nonfrozen) water, and it decreases in late fall and win- ter. In contrast, productivity rates in the tropics are high throughout the year, and turnover in the photosynthesis– respiration cycle is faster, exceeding by many times the rates experienced in a desert environment or in the far northern limits of the tundra. A lush hectare of sugar- cane in the tropics might fix 45 tonnes of carbon in a year, whereas desert plants in an equivalent area might achieve only 1% of that amount.
In the oceans, differing nutrient levels control and limit productivity. Regions with nutrient-rich upwell- ing currents off western coastlines generally are the most productive. Figure 19.4 shows that the tropical oceans
and areas of subtropical high pressure are quite low in productivity.
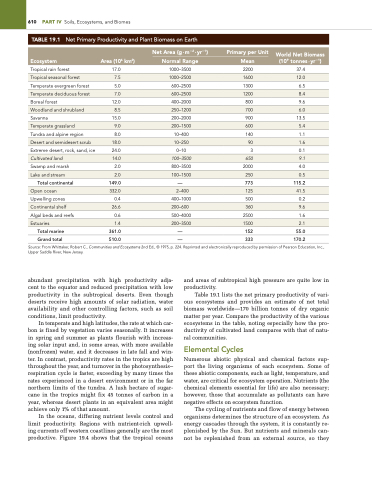
Table 19.1 lists the net primary productivity of vari- ous ecosystems and provides an estimate of net total biomass worldwide—170 billion tonnes of dry organic matter per year. Compare the productivity of the various ecosystems in the table, noting especially how the pro- ductivity of cultivated land compares with that of natu- ral communities.
Elemental Cycles
Numerous abiotic physical and chemical factors sup- port the living organisms of each ecosystem. Some of these abiotic components, such as light, temperature, and water, are critical for ecosystem operation. Nutrients (the chemical elements essential for life) are also necessary; however, those that accumulate as pollutants can have negative effects on ecosystem function.
The cycling of nutrients and flow of energy between organisms determines the structure of an ecosystem. As energy cascades through the system, it is constantly re- plenished by the Sun. But nutrients and minerals can- not be replenished from an external source, so they


