Page 651 - Geosystems An Introduction to Physical Geography 4th Canadian Edition
P. 651
 NITROGEN SOURCE FOR THE GULF OF MEXICO DEAD ZONE
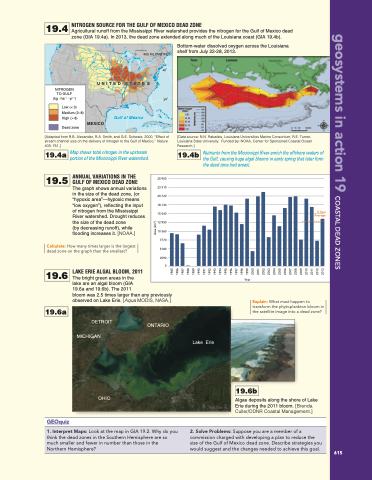
19.4 Agricultural runoff from the Mississippi River watershed provides the nitrogen for the Gulf of Mexico dead zone (GIA 19.4a). In 2013, the dead zone extended along much of the Louisiana coast (GIA 19.4b).
geosystems in action 19 COasTal DEaD ZONEs
0 400 KILOMETRES
UNITED STATES
Gulf of Mexico
MEXICO
[Adapted from R.B. Alexander, R.A. Smith, and G.E. Schwatz, 2000, “Effect of stream channel size on the delivery of nitrogen to the Gulf of Mexico,” Nature 403: 761.]
Bottom-water dissolved oxygen across the Louisiana shelf from July 22-28, 2013.
40°
NITROGEN TO GULF (kg · ha–1 · yr–1)
Low (< 3) Medium (3–8) High (> 8)
Dead zone
30°
19.4a Map shows total nitrogen in the upstream portion of the Mississippi River watershed.
ANNUAL VARIATIONS IN THE 19.5 GULF OF MEXICO DEAD ZONE
The graph shows annual variations in the size of the dead zone, (or “hypoxic area”—hypoxic means “low oxygen”), reflecting the input of nitrogen from the Mississippi River watershed. Drought reduces the size of the dead zone
(by decreasing runoff), while flooding increases it. [NOAA.]
Calculate: How many times larger is the largest dead zone on the graph than the smallest?
19.6a and 19.6b). The 2011
bloom was 2.5 times larger than any previously observed on Lake Erie. [Aqua MODIS, NASA.]
[Data source: N.N. Rabafais, Louisiana Universities Marine Consortium, R.E. Turner, Louisiana State University. Funded by: NOAA, Center for Sponsored Coastal Ocean Research.]
19.4b Nutrients from the Mississippi River enrich the offshore waters of the Gulf, causing huge algal blooms in early spring that later form the dead zone (red areas).
1985 1986 1987 1988 1989 1990 1991 1992 1993 1994 1995 1996 1997 1998 1999 2000 2001 2002 2003 2004 2005 2006 2007 2008 2009 2010 2011 2012 2013
Area (km2)
GEOquiz
LAKE ERIE ALGAL BLOOM, 2011
19.6 The bright green areas in the lake are an algal bloom (GIA
Year
19.6a
Explain: What must happen to transform the phytoplankton bloom in the satellite image into a dead zone?
DETROIT MICHIGAN
OHIO
1. Interpret Maps: Look at the map in GIA 19.2. Why do you think the dead zones in the Southern Hemisphere are so much smaller and fewer in number than those in the Northern Hemisphere?
25 900 23 310 20 720 18 130 15 540 12 950 10 360
7770 5180 2590
0
5-Year Average
ONTARIO
Lake Erie
19.6b
Algae deposits along the shore of Lake Erie during the 2011 bloom. [Brenda Culler/ODNR Coastal Management.]
2. Solve Problems: Suppose you are a member of a commission charged with developing a plan to reduce the size of the Gulf of Mexico dead zone. Describe strategies you would suggest and the changes needed to achieve this goal.
615


