Page 672 - Geosystems An Introduction to Physical Geography 4th Canadian Edition
P. 672
  636 part IV Soils, ecosystems, and Biomes aQuantitativeSOlUTiOn landscape Pattern analysis
Landscapes are mosaics: patterns of homogeneous patches that vary in size, shape, and cover type. Landscape pattern analysis is an emerging field of study that applies quantitative methods to describe and understand the nature of landscape patterns. It can be used to analyze patterns in natural landscapes, anthropogenic landscapes, or natural landscapes affected by human activity. A key application of landscape pattern analysis is to assess how human activity causes fragmentation of natural landscapes. Frag- mentation of larger landscapes results in smaller intact areas and increases the frequency of edges that negatively impact ecosys- tem functioning. Consider the patterns created by clearcutting the forests shown in Figure 19.22. How would you describe—and then compare—those patterns quantitatively?
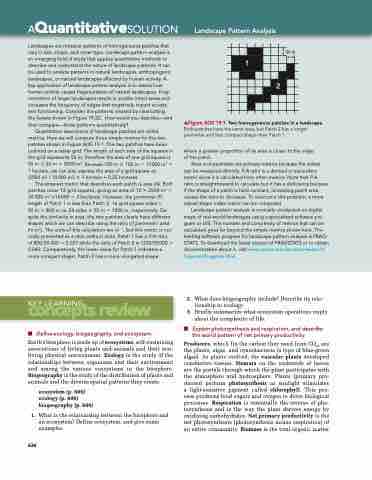
Quantitative descriptors of landscape patches are called metrics. Here we will compute three simple metrics for the two patches shown in Figure AQS 19.1. The two patches have been outlined on a raster grid. The length of each side of the squares in the grid represents 50 m; therefore the area of one grid square is 50 m × 50 m = 2500 m2. Because 100 m × 100 m = 10000 m2 = 1 hectare, we can also express the area of a grid square as
(2500 m2 / 10 000 m2) × 1 hectare = 0.25 hectares.
The simplest metric that describes each patch is area (A). Both patches cover 12 grid squares, giving an area of 12 × 2500 m2 = 30 000 m2 (/10 000 = 3 hectares). However, the perimeter (P) length of Patch 1 is less than Patch 2: 16 grid square sides ×
50 m = 800 m vs. 24 sides × 50 m = 1200 m, respectively. De- spite the similarity in area, the two patches clearly have different shapes which we can describe using the ratio of perimeter: area (m:m2). The units of this calculation are m−1, but this metric is nor- mally presented as a ratio without units. Patch 1 has a P:A ratio of 800/30 000 = 0.027 while the ratio of Patch 2 is 1200/30 000 = 0.040. Comparatively, the lower value for Patch 1 indicates a more compact shape; Patch 2 has a more elongated shape
50 m
mFigure AQS 19.1 Two homogeneous patches in a landscape. Both patches have the same area, but Patch 2 has a longer perimeter and less compact shape than Patch 1.
where a greater proportion of its area is closer to the edge of the patch.
Area and perimeter are primary metrics because the values can be measured directly. P:A ratio is a derived or secondary metric since it is calculated from other metrics. Note that P:A ratio is straightforward to calculate but it has a deficiency because if the shape of a patch is held constant, increasing patch area causes the ratio to decrease. To overcome this problem, a more robust shape index metric can be computed.
Landscape pattern analysis is normally conducted on digital maps of real-world landscapes using a specialized software pro- gram or GIS. The number and complexity of metrics that can be calculated goes far beyond the simple metrics shown here. The leading software program for landscape pattern analysis is FRAG- STATS. To download the latest version of FRAGSTATS or to obtain documentation about it, visit www.umass.edu/landeco/research/ fragstats/fragstats.html.
            1
   2
     concepts review
key learning
   ■ Define ecology, biogeography, and ecosystem.
Earth’s biosphere is made up of ecosystems, self-sustaining associations of living plants and animals and their non- living physical environment. Ecology is the study of the relationships between organisms and their environment and among the various ecosystems in the biosphere. Biogeography is the study of the distribution of plants and animals and the diverse spatial patterns they create.
ecosystem (p. 606) ecology (p. 606) biogeography (p. 606)
1. What is the relationship between the biosphere and an ecosystem? Define ecosystem, and give some examples.
2. What does biogeography include? Describe its rela- tionship to ecology.
3. Briefly summarize what ecosystem operations imply about the complexity of life.
■ Explain photosynthesis and respiration, and describe the world pattern of net primary productivity.
Producers, which fix the carbon they need from CO2, are the plants, algae, and cyanobacteria (a type of blue-green algae). As plants evolved, the vascular plants developed conductive tissues. Stomata on the underside of leaves are the portals through which the plant participates with the atmosphere and hydrosphere. Plants (primary pro- ducers) perform photosynthesis as sunlight stimulates a light-sensitive pigment called chlorophyll. This pro- cess produces food sugars and oxygen to drive biological processes. Respiration is essentially the reverse of pho- tosynthesis and is the way the plant derives energy by oxidizing carbohydrates. Net primary productivity is the net photosynthesis (photosynthesis minus respiration) of an entire community. Biomass is the total organic matter
636


